Chapter 26: The Spread: one stock against another
Take the market out of the claim: one long, one short, one month, and a confidence that only selection can earn.
By Matt Lang and Bree Lang · About the authors
Where this is on Sifter: Training Floor · Exercises · Spread
Why a pair
Imagine that the S&P climbs 20 percent this year and your Sprint calls keep coming in. How much of that record was your doing? In a rising market nearly everyone who owns stocks looks like a good stock picker, so a reader of your record cannot tell whether your wins came from picking the right stocks or from holding stocks while the whole market went up. Time answers that complaint slowly, because a record that stays calibrated through a rising market, a falling one and the choppy stretches between is worth far more than one built in a single good year. The Spread answers it directly.
You choose two companies, going long one and short the other, and one month later the call settles in your favor if, and only if, the long finished ahead of the short. Whatever the market does over the month shows up in both legs and subtracts out of the comparison. If everything falls 8 percent while your long falls 5 and your short falls 9, you were right, because the claim was about the two companies relative to each other. Two companies in the same industry, over one month, are very close to a coin flip against each other, closer than a single stock is against the index, because the thing that pushes them both around has been removed.
One spread proves nothing. A hundred spreads at a stated 60 percent that land about 60 percent of the time prove something no other exercise on the Floor can, because the market cannot have done any of the work. The card labels the Spread's bars "said vs actually won" and notes that the base rate is about 50 by construction, so anything above the line is selection skill rather than the market.
The page
The page is the Sprint's page with two blanks instead of one. The sentence at the top says "[The long] will beat [the short] over the next month.", each blank is a search box, and under it the page prints both company names with their prices and the head-to-head, how often the first has finished ahead of the second over a month across the years the two share. The slider, its line, the two boxes and the two doors are the ones Chapter 24 taught, with one addition. Set the slider below 50 and the line tells you to swap the sides, because a spread you think will lose is a spread the other way round.
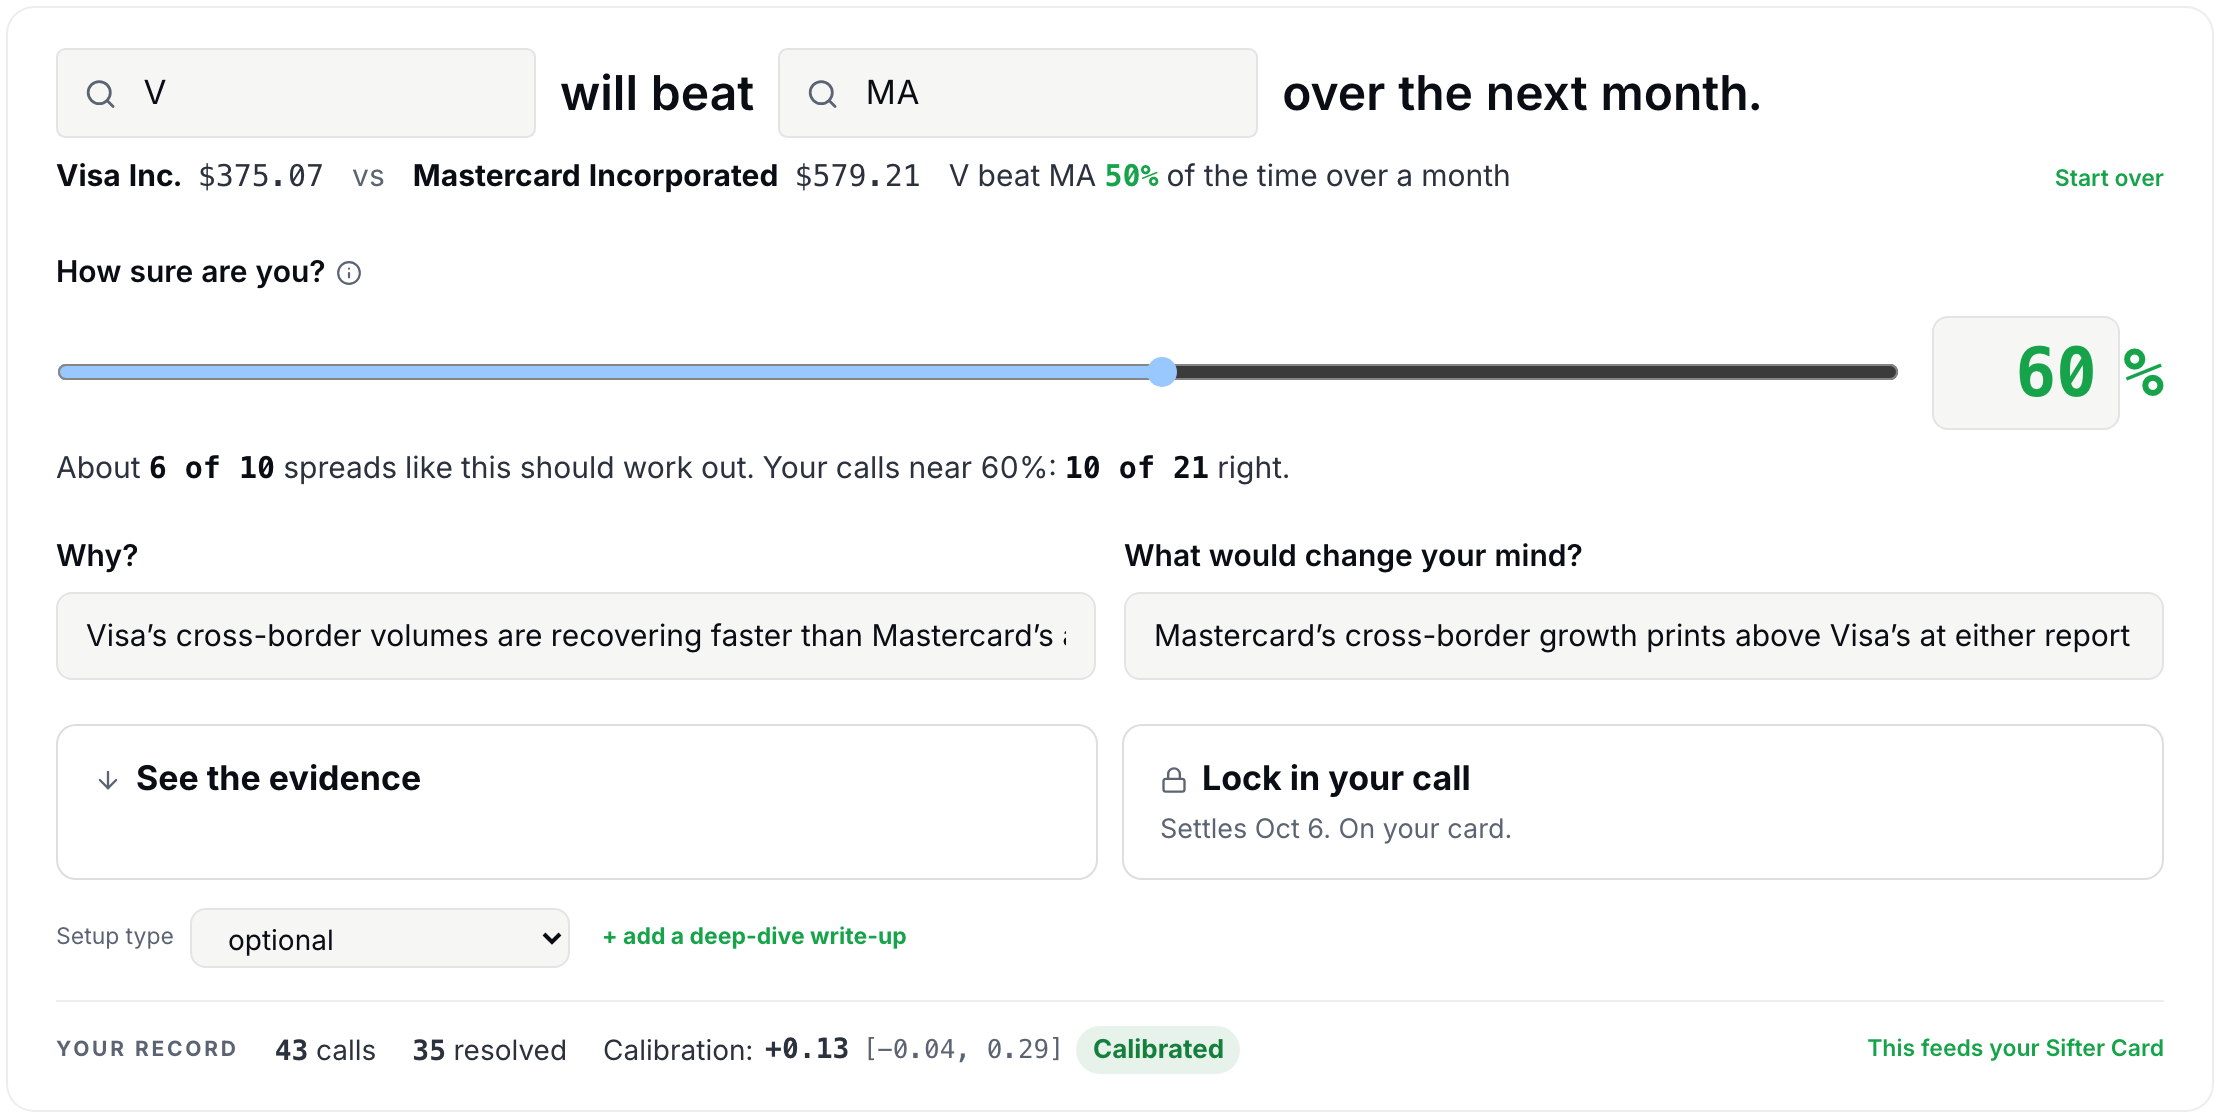
What is doing the hedging
The pair for the rest of this chapter belongs to Ivo Prentice, the most cautious analyst at the Maple Fund, who has spent a quarter on two airlines and concluded that Pacific Crest Air's fuel hedges are worth more than the market is paying for them. The call is long Pacific Crest Air, short Sunward Air. Over fifteen shared years, which hold 3,720 overlapping month-long stretches, Pacific Crest finished ahead of Sunward in 51 percent of them, so the uninformed call is 51, and everything Chapter 24 said about the simplest call applies to it.
A pair adds one piece of arithmetic the Sprint did not have, and you should do it before the evidence door opens, because it decides how much of your result will belong to the market.
How a spread settles
Each leg's beta is the regression slope on the S&P from Chapter 6, measured over the last 60 sessions. Long one beta and short another, and the market exposures subtract. The difference is the market bet you are still carrying, and zero is what "market-neutral" actually means.
The first line of the formula says how a spread settles, and the second line is the check on it. A spread is only free of the market when the two betas are close, and nothing about having one long and one short guarantees that. Two more numbers on the page matter for the same reason, each leg's volatility and how closely the two move together, because they decide how much risk the pair carries once the market is out. Let's run Prentice's pair through all of it, because most students come to this exercise believing something about hedging that the arithmetic does not support.
Worked example: Worked example: what is doing the hedging
The page shows Pacific Crest beta 1.32, Sunward beta 1.18, annualized volatilities 34% and 38%, and a correlation of their daily returns of 0.81 over the last two years. Many of you will say the short leg is the hedge. Let's check.
- The market exposure left over β_net = 1.32 − 1.18 = 0.14 The pair is not quite neutral. It behaves like 14% of an index position, so a 5% market rally would push the spread up about 0.7% through beta alone, before either airline does anything airline-specific.
- The spread's risk if the legs were independent σ² = σ_long² + σ_short² = 34² + 38² = 2600; σ = √2600 ≈ 51% Two independent legs make a position riskier than either leg alone, about 51% annualized, because a short adds its own variance just as a long does, so shorting by itself is not hedging.
- Include the correlation σ² = σ_L² + σ_S² − 2ρσ_Lσ_S = 2600 − 2 × 0.81 × 34 × 38 = 507; σ = √507 ≈ 22.5% At a correlation of 0.81, the covariance term cancels most of the risk, and the pair runs at about 22.5% annualized against 38% for the riskier leg.1 The correlation is the hedge, and if the two airlines ever stop moving together, the hedge is gone while both positions remain.
- Scale it to the month σ_month = 22.5% × √(21/252) = 6.5% A typical month moves this spread about 6.5% one way or the other, which is the square-root-of-time scaling from Chapter 5 run in reverse. Any thesis about this pair is measured against that. An edge worth one point is small against a ±6.5% month, which is why the confidence number should stay modest.
So the correlation is the hedge, and the short leg is a second position that happens to be paid for by the first. That distinction matters most on the day it breaks, when two companies that moved together for years stop doing so and the pair suddenly carries the risk of both. The net beta is the simpler of the two checks, and it is the one people skip, so try it on a pair that is labeled market-neutral.
Practice
A classmate builds a pair that is long a beta-1.45 semiconductor stock and short a beta-0.85 utility, and calls it market-neutral because it has one long and one short. What is the pair's net beta?
Solution. Subtracting the short leg's beta from the long leg's gives 1.45 − 0.85 = 0.60. Take a moment to think about what a net beta of 0.60 means for a pair labeled market-neutral. The position still behaves like more than half of an index position, and in a 10% market rally it would gain about 6% before either company did anything of its own. This means that a reader scoring the month would mostly be grading the S&P rather than the analyst. The classmate earned the label by counting legs, but neutrality is a property of the betas, and these two betas do not cancel.
The three cards, for a pair
Press "See the evidence" and the three cards open, built as Chapter 24 built them, with their Open buttons and the full-screen view behind each. What changes is what the cards say.
The first card is the pair's own behavior. For Prentice it says, "Typical month ±6% either way," followed by a sentence about which way the market leans, which is the net beta from the worked example stated in words, and under it the head-to-head, the net market bet and how closely the two move together. The second card is the Sprint's "days like today" asked of a spread. The page measures how far each leg is below its own 52-week high, finds every past day when the difference between those two readings looked about like it does today, and counts what the long minus the short did over the month that followed. The third card is the calendar, and on a one-month horizon it can matter more than everything above it. If either company reports earnings inside the month the card says so in bold, and if the short goes ex-dividend inside the month the card points out that, being short, you pay that dividend, and it comes off your lead.
Read the cards the way Chapter 24 taught, starting at the head-to-head and moving the number only where a card gives a reason. Run them on Prentice's pair on an ordinary day and you land at about 53, a point or two above the head-to-head. The twelve points between that and the 65 he wants to say are his claim about the fuel hedges, and the first box is where he writes it down. The page will take those points if he writes them down, but it will not supply them.
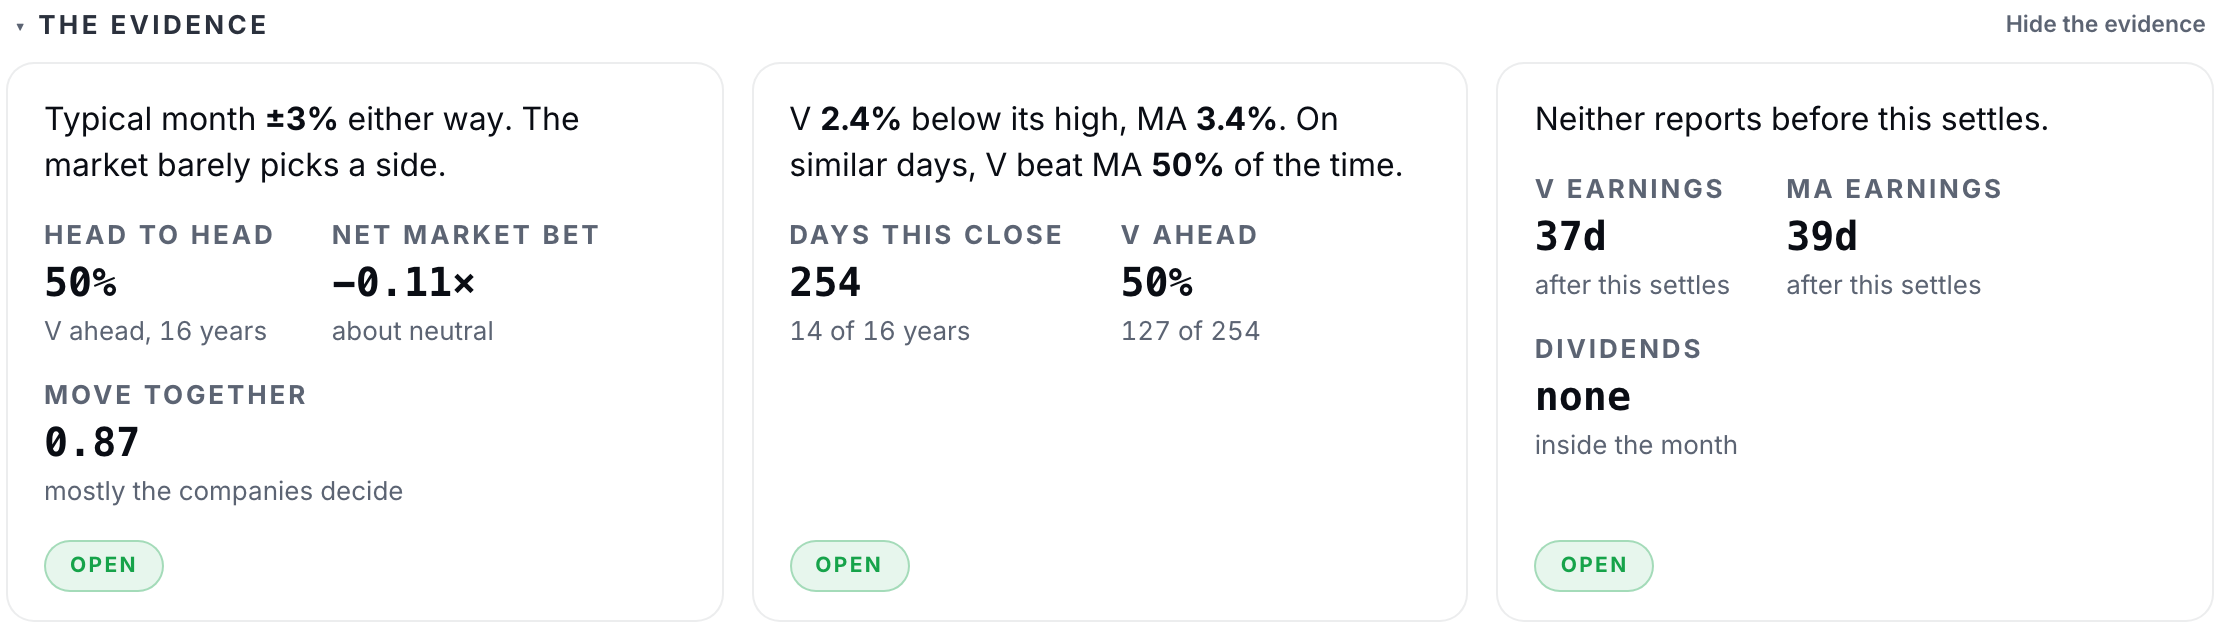
The harder case is the one where the cards pull in different directions. Here is the same pair on a different day, with a large market lean, few matched days, and both airlines reporting inside the month.
Worked example: Worked example: when the evidence disagrees
Three cards with three different messages. Take them one at a time.
- Card one: the pair and the market Net beta 0.45, and the page says a rising market favors Pacific Crest This is a warning rather than a reason. A net beta that large means a good month for the market would settle the spread in your favor whether or not the fuel hedges mattered, so part of any win would be the market's, and you should discount your own confidence accordingly.
- Card two: days when the spread looked like today 61% on 90 matched days, spread across four years Up, carefully. Ninety days in four years is a thin sample, so add two or three points rather than ten.
- Card three: the calendar Both report inside the month No move on the number and a larger note in the second box. Two reports inside one month means two mornings that can each move the spread by more than your whole edge.
- Your number Long Pacific Crest at about 55 Four points above the head-to-head rather than fourteen, with a reason attached to each point, and a market lean that a reader can see you accounted for.
Fifty-five is a modest number for a man who has spent a quarter on two airlines, and it is modest because the evidence did not support more. The table below shows the two boxes for that call, and the next section explains the rule they follow.
The two boxes for that spread
| Box | What you would type |
|---|---|
| Why? | Pacific Crest has hedged 70% of next year's fuel below spot and Sunward has hedged none, so a fuel spike hits Sunward's margin first; the market prices the two as one trade. |
| What would change your mind? | The hedge book marked below 60% of notional in the Q1 filing, or Sunward announces a hedge program before the month is out. |
One line each. Notice that both lines are about something one airline has and the other does not. Anything that is true of both legs, cheap fuel, a good quarter for air travel, a rally in the market, cancels out of the spread and has no business in either box.
What would change your mind
The three tests from Chapter 24 apply unchanged, observable, dated and decisive, and a pair adds one rule on top, subtraction. Every fact you gather about Pacific Crest has to survive the question, "and how much of that is also true of Sunward?" A great quarter for air travel lifts both airlines and cancels out of the spread, cheap fuel does the same, so whatever helps both legs equally is invisible to the call. Whatever survives the subtraction, here the hedging policy that one airline has and the other does not, is the only thing the spread will ever pay for.
So the line under "What would change your mind?" should state the pair-specific fact and the number that would break it ("the hedge book marked below 60 percent of notional in the Q1 filing") rather than a condition the two legs share ("airlines sell off"). If nothing in your reasoning survives the subtraction, you have not built a spread, only a long call and a short call written in the same paragraph.
The same subtraction catches a mistake students make with the evidence. The page also prints each leg's record against the S&P, and it is tempting to read two losing records as a bad pair. The question below is that case.
Check yourself
A classmate looks up each leg's record against the S&P and finds both losing, the long beating the index 47% of months and the short 45%, and says the pair is therefore a bad bet. What is the flaw?
- No flaw: two below-average stocks make a below-average pair. The outcome of a pair is the difference between its legs, which means that both stocks can trail the index while one of them reliably trails it by less, and the one that trails by less makes a perfectly good long against the other.
- The spread settles long-versus-short, so only the head-to-head rate speaks to it; the vs-index rates cancel out of the claim just as the market's move does. (correct) Right, and this is the same reason the page never presents a vs-index figure as an edge for the pair. The two records against the S&P are context about the individual legs, and the only base rate that speaks to the spread is the pair's own head-to-head.
- The rates are too old to matter. Those records cover the same month-long windows as the head-to-head, so they are not stale. The trouble is that the spread settles long-versus-short, and a record against the index says nothing about that comparison however recently it was measured.
Lock the spread
The lock, the ten-minute void, the entry price rule (a lock during the session is priced at that day's close and a lock at any other time at the next open, for both legs at once), the row under "Your spreads", the post-mortem and the deep-dive write-up all work as they did in Chapter 24. What differs is the settlement. A month later the platform takes each leg's return over the window, from the entry mark to the same mark on the settlement day, and subtracts the short's from the long's, and if the difference is positive you were right. The market's move is in both numbers and falls out of the subtraction, so the settlement never asks what the S&P did. The row shows the realized spread in points next to Won or Lost, and the post-mortem's middle label, right but not for my reason, comes up more often here than anywhere else, because a spread that a report decided is a spread that won for a reason you did not give. The question below settles one by hand.
Check yourself
Over the month, the S&P falls 8%. Your long falls 5% and your short falls 9%. How did the call settle?
- Wrong: the long lost money. The question the Spread settles is whether the long finished ahead of the short, not whether the long made money on its own, and a leg can lose value while still winning that comparison.
- Right: the long beat the short by 4 points, and the market's direction is irrelevant to the claim. (correct) Right. A long that falls 5% against a short that falls 9% settles the spread at +4. The market's move showed up in both legs, which means that it subtracted out of the comparison and left behind only the relative claim that was actually made.
- Void: calls do not settle in down markets. Spread calls settle in every market, up or down, because the exercise was built so that the market's direction cancels out of the claim entirely.
When your 60s land five times in ten, the questions to ask are pair questions. Were the two legs so alike that the spread was pure noise, a correlation of 0.9 and a typical month of two points? Was the net beta large enough that you were making a market call and calling it a pair? Did a report inside the month decide the spread before your reason had a chance to? The bench under the cards can answer each of those.
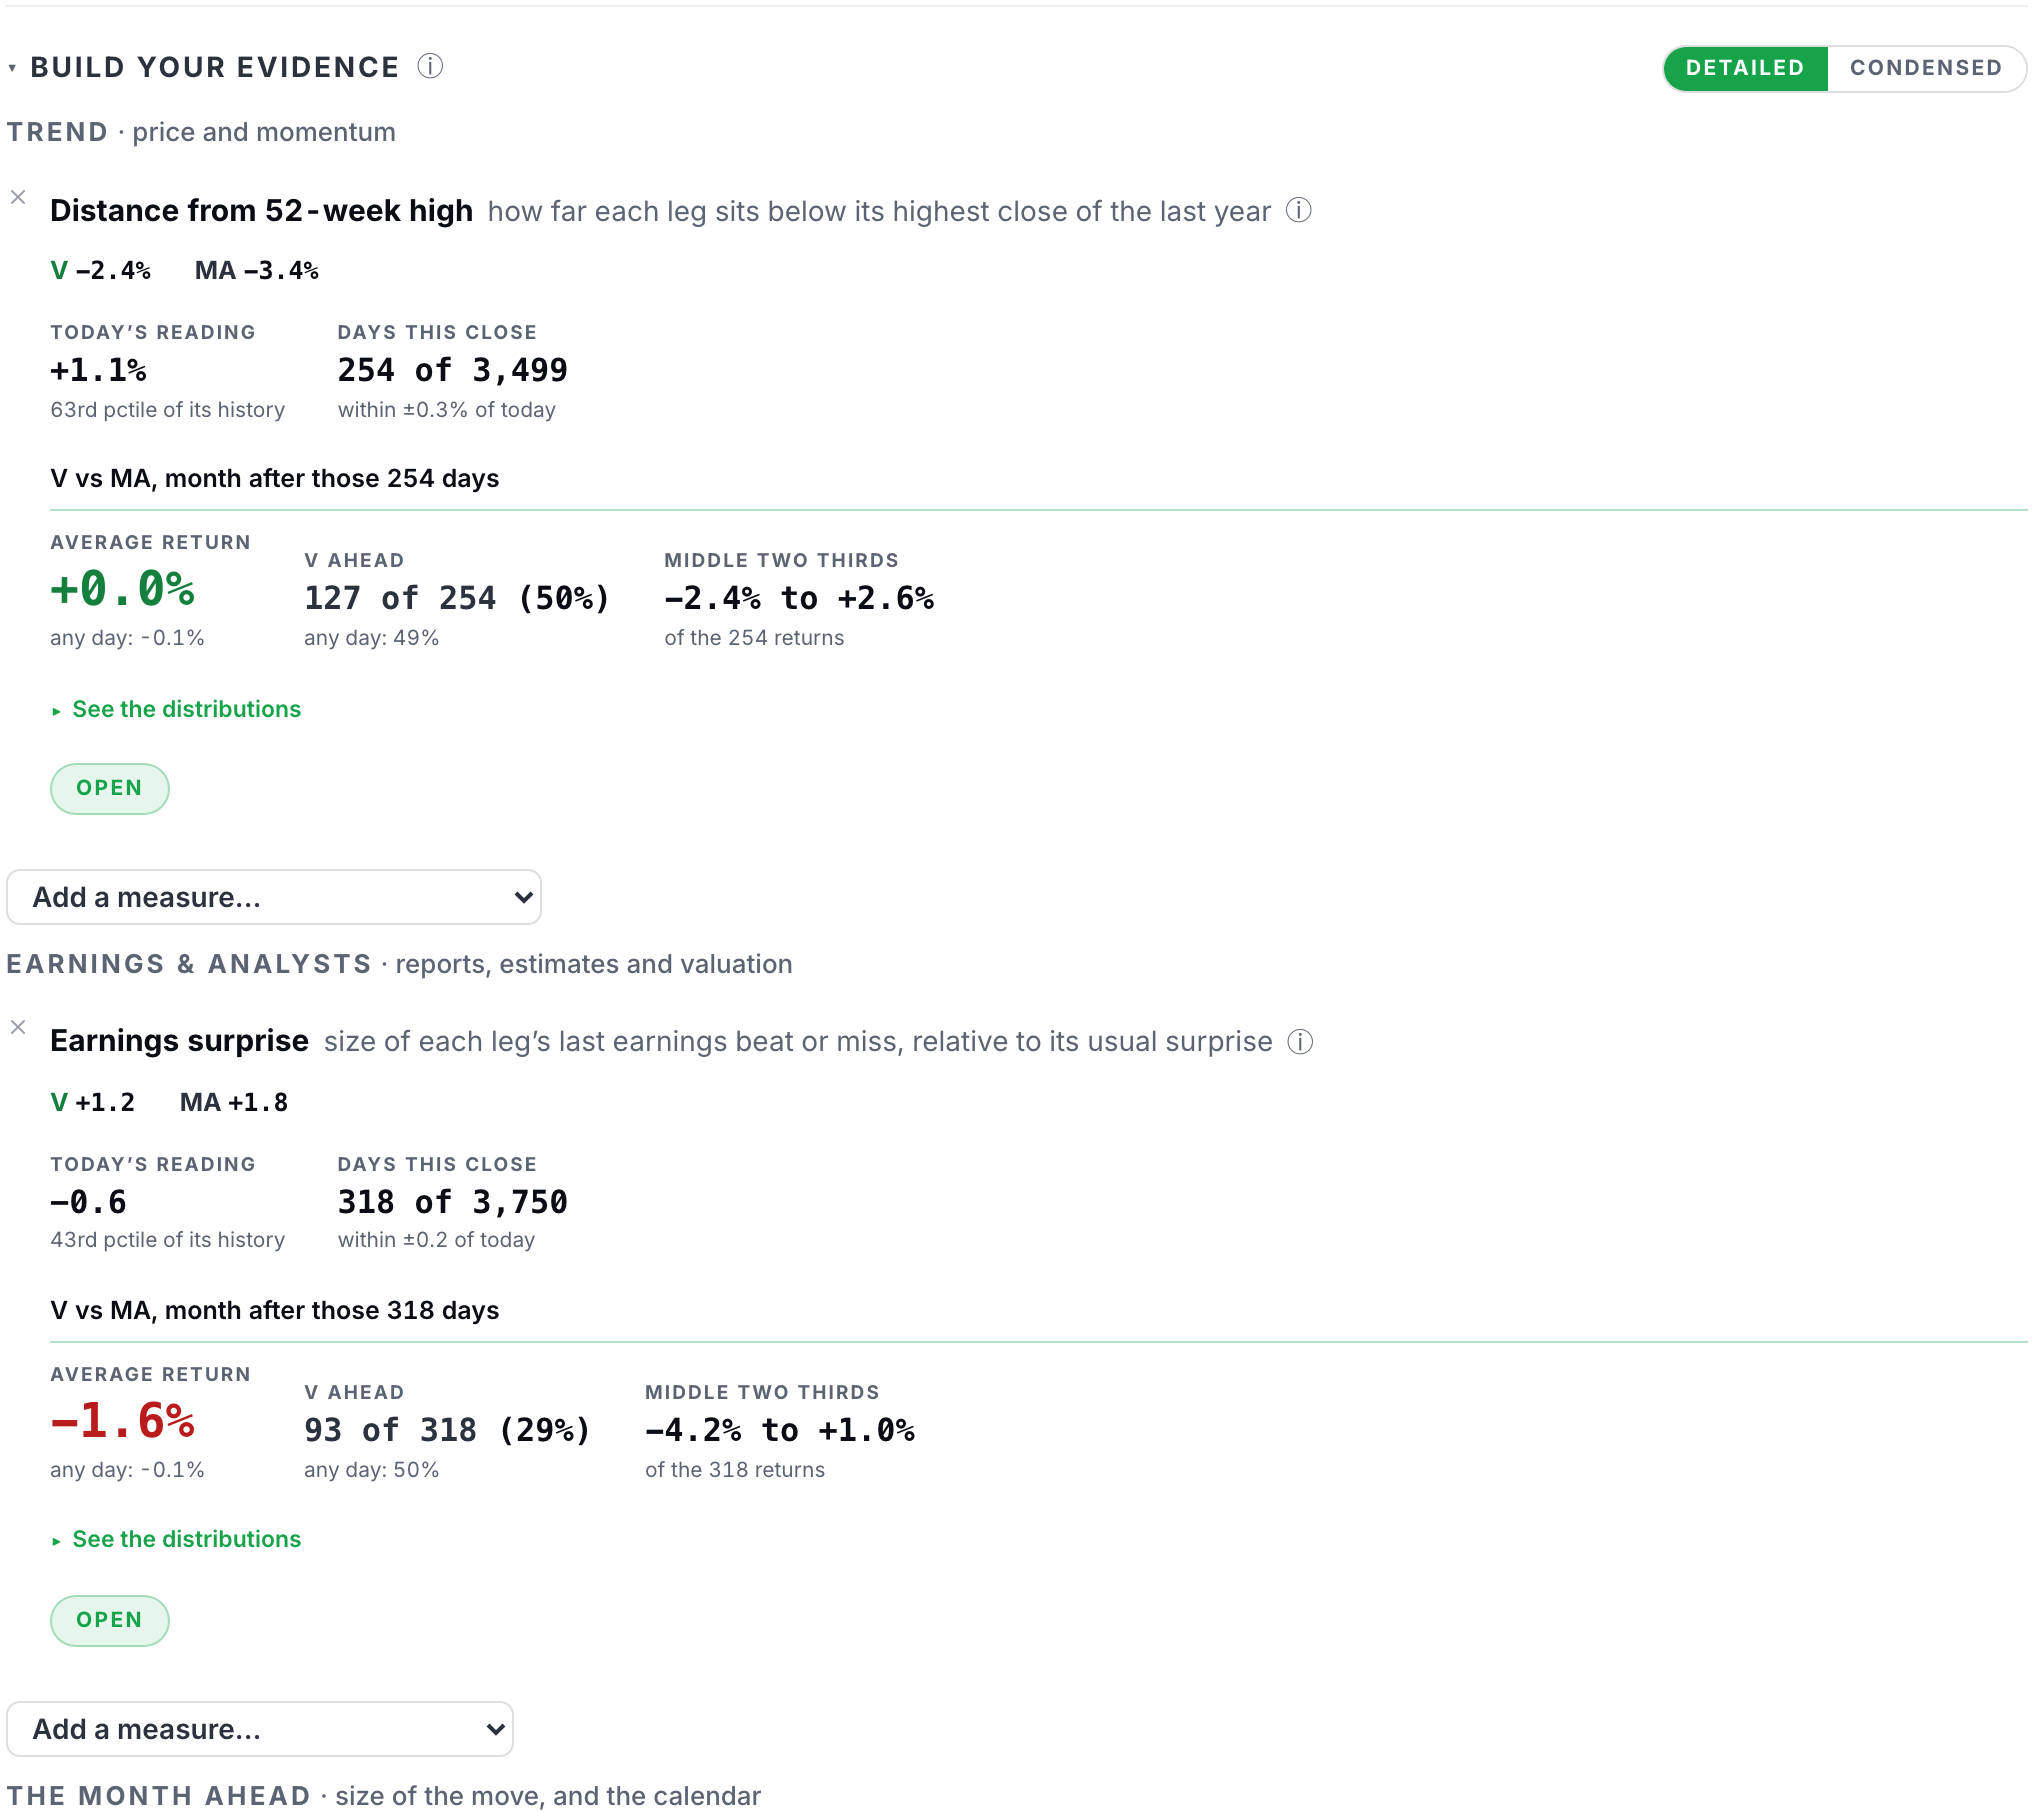
The bench, for a pair
The workbench under the cards is the one Chapter 25 taught, with the same controls, and everything in that chapter applies here unchanged. Three things differ for a pair. A row takes the difference between the two legs' readings on its measure, finds the past days when that difference was about what it is today, and reports what the long minus the short did over the month that followed, so every row on the bench is a pair outcome rather than a stock outcome, and Open shows the spread's own days with each leg on its own days under them. When events overlap gives each condition its own subject, the long, the short, or the long minus the short, and seeds the first measure you picked on the long, the second on the short and a third on the difference, so you can ask for the days when both legs were somewhere in particular at the same time, say Pacific Crest near its high while Sunward's RSI was in its bottom fifth, and the outcome is still the long minus the short. And there is no market card, because the market has already been subtracted out of the claim, and a page that filtered a pair's history by regime would be putting back the thing the exercise removed.
The oldest quantitative desks ran a version of this trade for decades, buying the leg that had fallen behind and shorting the one that had run ahead, and they made real money at it until the crowd found it and the profits thinned.2 The trade is real, and the easy version of it no longer pays, which is one reason the page gives you evidence rather than a signal.
What reaches your card
The Spread arrives on your Sifter Card as its own tile with the same three numbers as the Sprint, the pairs settled, your average confidence, and the share you won. Open the tile and a recruiter sees the bars, "said vs actually won," with the note that the base rate is about 50 by construction, then every settled spread drawn as the realized difference between the legs, so the reader can see whether your wins were wide and your losses narrow or the other way round, then the pairs themselves, each with its thesis and the line about what would have changed your mind. The page cannot say you are a good investor, because a month is short and a pair is nearly a coin. It can say that when you put a number on one company against another, the number held up, and a rising market cannot make that claim for you.
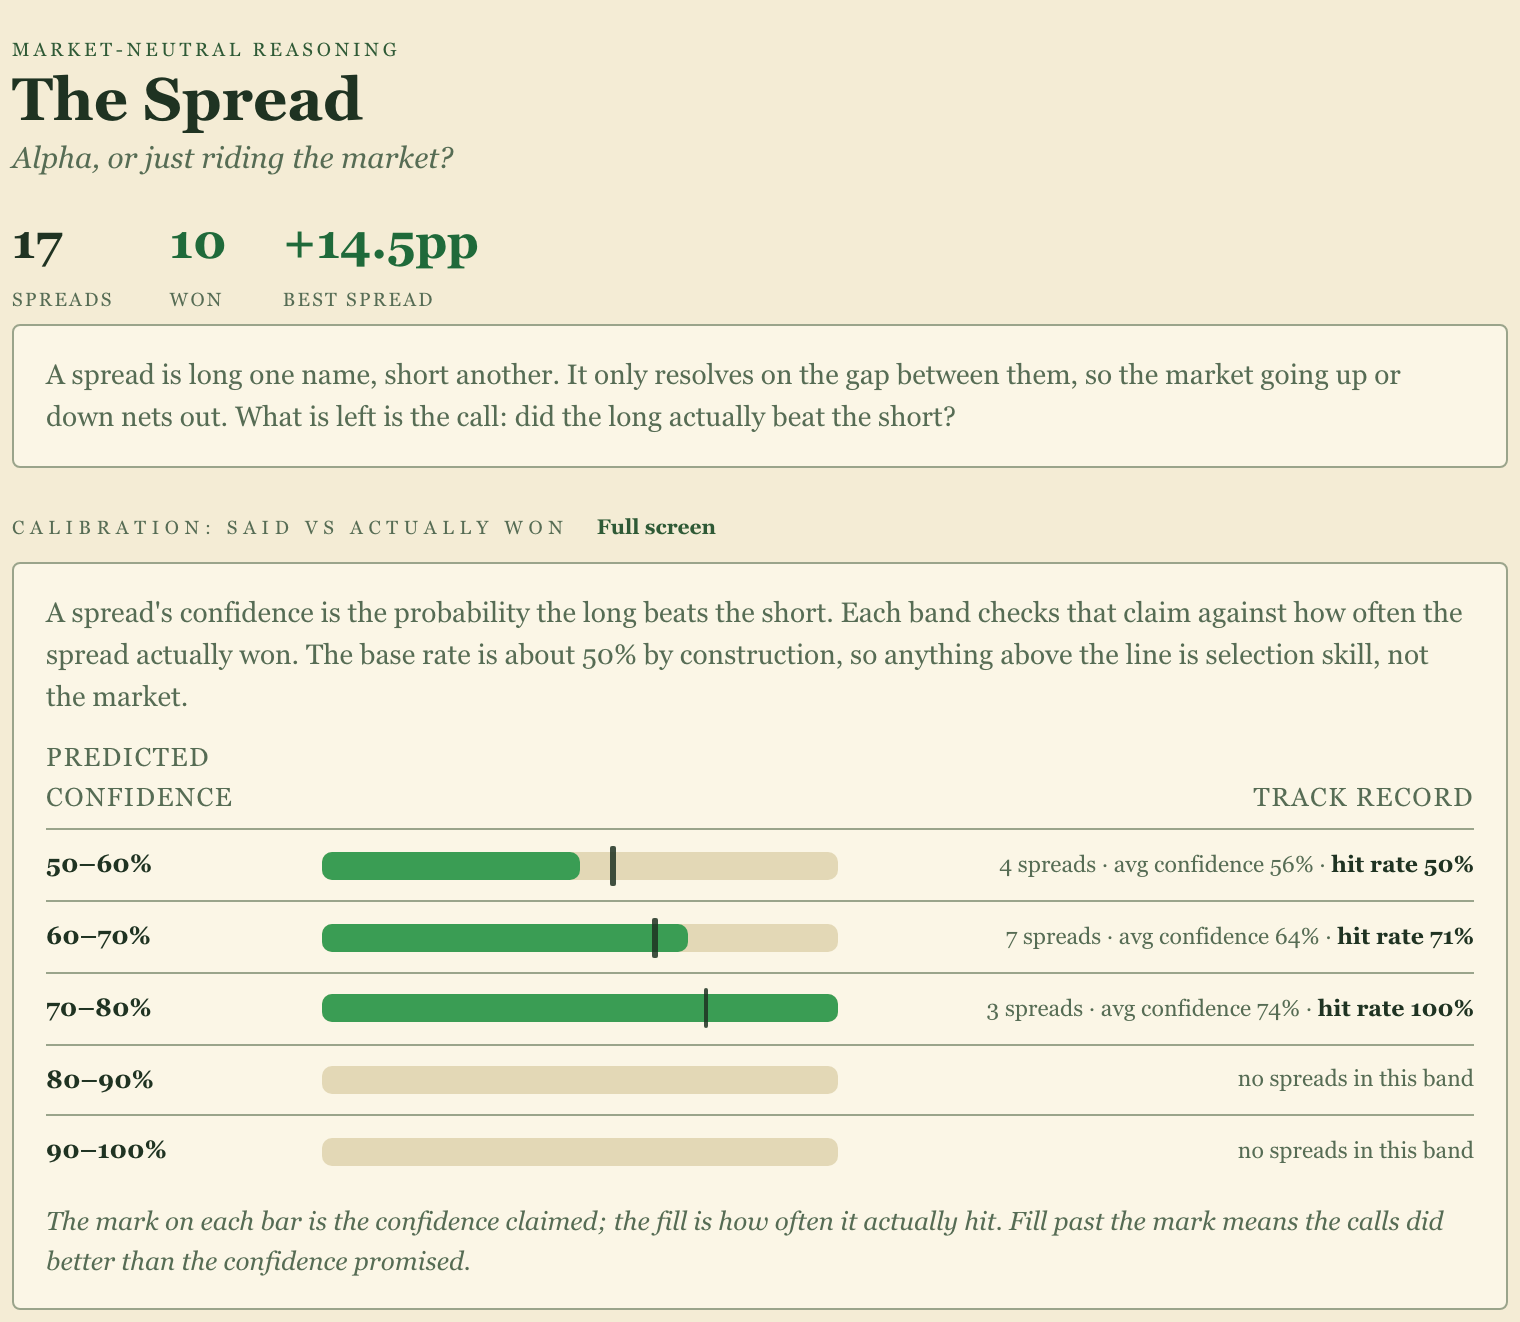
Everything on that page came from a sentence with two blanks, a slider and two lines of text, settled by arithmetic a month later. The last thing to do in this chapter is to go and fill them in.
Sources
- Markowitz, H. (1952). Portfolio selection. Journal of Finance, 7(1), 77-91 https://doi.org/10.1111/j.1540-6261.1952.tb01525.x
- Gatev, E., Goetzmann, W. N., and Rouwenhorst, K. G. (2006). Pairs trading: Performance of a relative-value arbitrage rule. Review of Financial Studies, 19(3), 797-827 https://doi.org/10.1093/rfs/hhj020
The Analyst's Handbook is Sifter's textbook for student investors, written by Matt Lang and Bree Lang. Sifter is free for students. This chapter as markdown.