Chapter 25: Can we do better? The Sprint workbench
For the day three cards are not enough: pick your own measures, read the pictures behind the numbers, weigh the column, and search the stock's history for the days when your conditions held at once.
By Matt Lang and Bree Lang · About the authors
Where this is on Sifter: Training Floor · Exercises · Sprint
The three evidence cards that open on the Sprint page when you press "See the evidence" are enough for most calls. The workbench under them is for the calls where you want more evidence before you set your confidence level. It lets you pick the measures you think matter for this stock, see the history behind each one, weigh them against one another, and search fifteen years for the days when several of your conditions held at once. In some cases the additional information will not change your number. In others it can show you an edge that would otherwise be hard to see, and the workbench also shows you how much of that edge survives a second look. This chapter builds the workbench up in the order the page does.
Everything on it is built from one idea you already know, the row. A row takes one measure, finds the days in the company's own history when it read about what it reads today, and reports what the next two weeks did against the S&P. The four sections below build the workbench up in the order the page does, from a single row, to the points behind it, to the whole column, to two conditions at once, and the appendix lists every measure the bench offers. Nothing here changes what a call is or how it settles. It changes only how much you know before you type the number.
The bench: three sections to fill
Under the three evidence cards is a block of its own, "The full workbench, for advanced users." It stays folded until you open it, and its link opens this chapter. Open it and you meet two folded bands, Build your evidence and What it adds up to, with the All stocks map above them, and an Expand next to the chapter link that shows the whole workbench at nearly full screen with the measures you have picked as a strip across the top, each one a jump to its row. Once two measures are on the bench a third line appears at the foot of the block, When events overlap, which searches the stock's own history for the days when your conditions held at the same time. The market you met behind the third card is not down here, because it filters the all-stocks figures and the bench is the stock's own history.
Build your evidence opens on three empty sections, Trend, Earnings & analysts and The two weeks ahead, with a menu of measures under each. Nothing is chosen for you, so every row on the bench is one you asked for, and the replay two weeks later shows the rows you chose rather than a default. Under Trend, pick the distance from the 52-week high, the same measure as the second card, so you already know how to read it. Under Earnings & analysts, pick the earnings surprise, the size of the last beat or miss relative to the company's usual surprise, which the row places in the percentile of the company's own history. Under The two weeks ahead, pick the days to the next report. Its row counts what followed like any other, but a calendar fact picks no side, so read that count as context rather than as an edge, because "thirty-eight days to earnings" cannot be turned into one.
Every signal row has the same anatomy. Today's reading and its percentile are on the left, then the days this close, with the band they were matched inside and a note if it had to be widened, and under both is what followed, the average two-week return against the S&P, the count that beat it against the any-day base rate, and the middle two thirds of the outcomes. Under each row is an Open button, which shows the measure at full screen with the arrows walking the measures you picked, and at the right of the band's title is a switch, Detailed or Condensed. Condensed turns every section into a small table with one line per measure, so that a bench of ten fits on one screen.
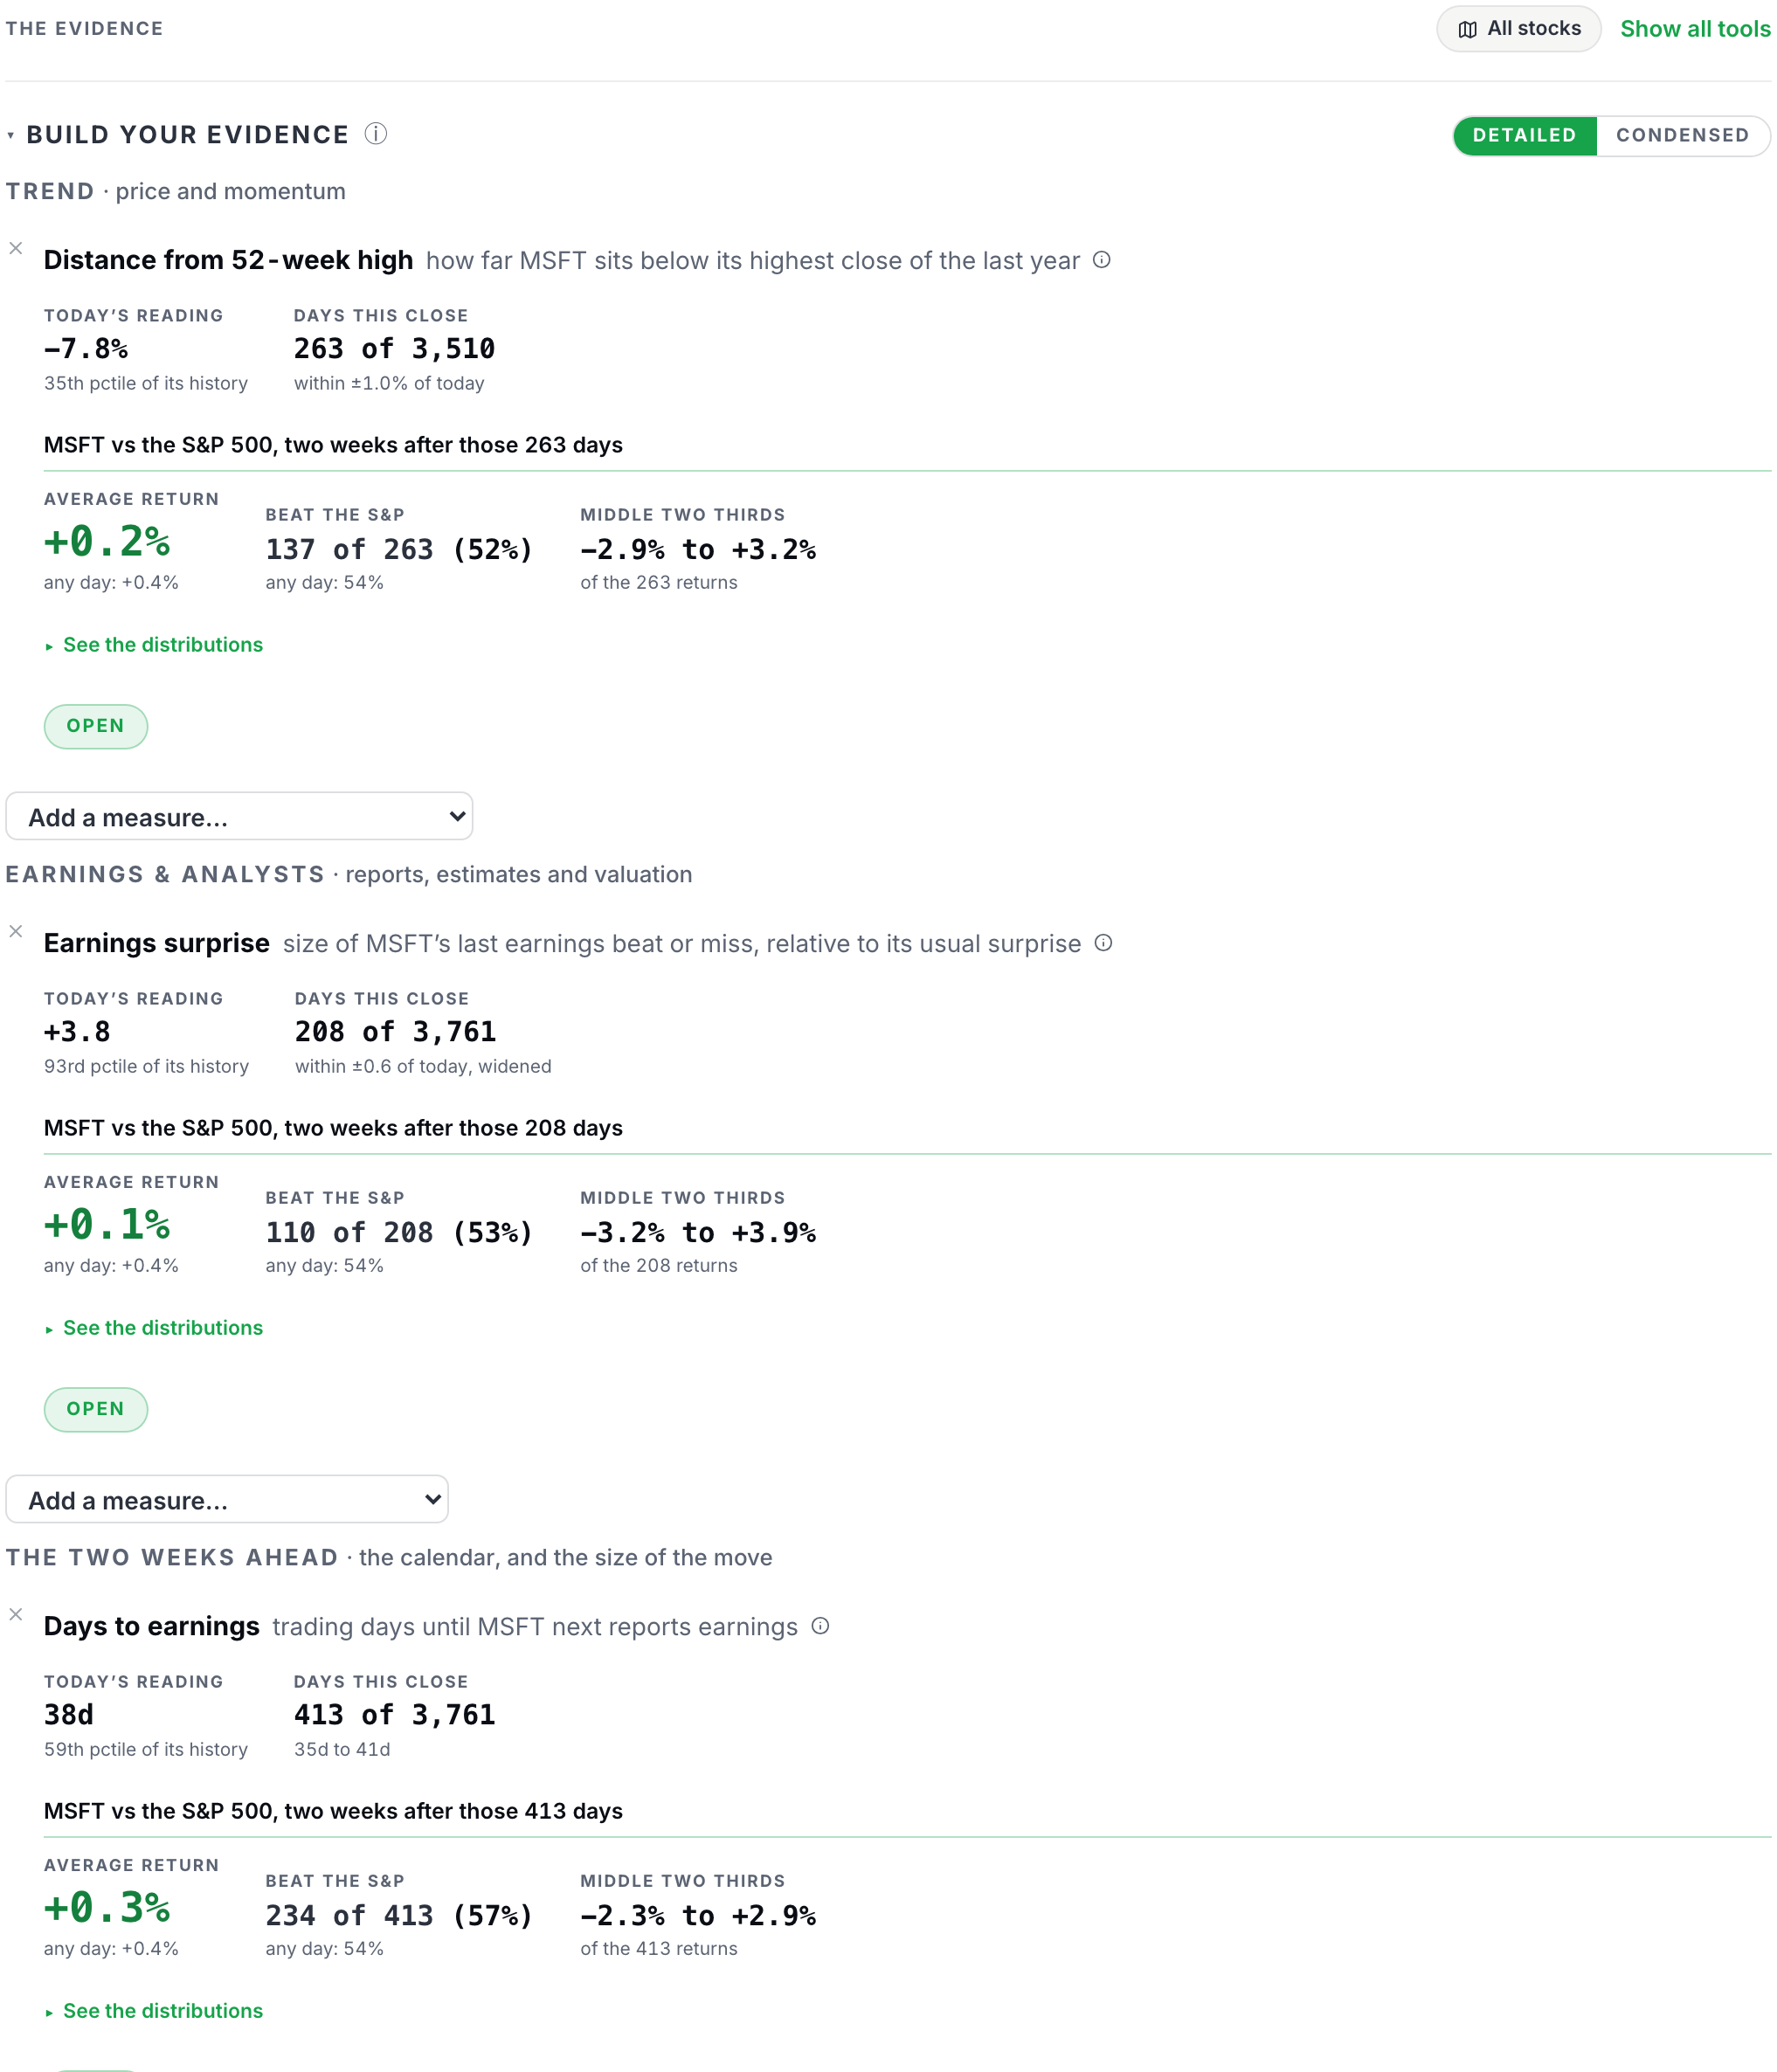
The menu under each section lists that section's catalog, 40 measures in all across the three, with the core measures first and the rest below them. They come in three kinds, and every row counts what followed whatever its kind, so the kind tells you how much to make of the count. A signal measure has a direction, so its count can be an edge. A scale measure such as beta sizes the move without saying which way it goes. A context measure such as the trailing P/E is a fact, because there is no sensible way to turn "the P/E is 31" into a side.
The table below shows five of them, the three we just picked and one of each of the other two kinds. The full catalog is in an appendix at the end of the chapter, one line per measure, read from the page's own list so that it changes when the bench does.
Five measures, one of each kind you will meet
| Section | Measure | What it shows | Kind |
|---|---|---|---|
| Trend | Distance from 52-week high | Price against the 52-week high. Zero is at the high; −20% is a fifth below it. | Signal (has a direction) |
| Earnings & analysts | Earnings surprise | The last report’s beat or miss against consensus, divided by the standard deviation of the previous eight surprises. +2.0 is a beat twice the usual size. | Signal (has a direction) |
| The two weeks ahead | Days to earnings | Sessions until the next scheduled report. Ten or fewer means the report lands inside a two-week call. | Context (a fact) |
| The two weeks ahead | Beta to the S&P | Slope of the stock’s daily returns on the S&P’s over the last 60 sessions. 1.00× moves one for one; 2.00× moves twice as far, both ways. | Scale (sizes the move) |
| Earnings & analysts | P/E, trailing | Split-adjusted price divided by trailing twelve-month EPS. Days with negative or near-zero earnings are left out. | Context (a fact) |
The first three are the rows we picked first. Beta and the trailing P/E are here to show what a scale measure and a context measure look like: both are placed on the company's own history, and neither has a beat rate.
See the distributions
Under every row is a small link, "See the distributions," and it shows you the pictures behind the row's numbers. Press it on the 52-week row and two histograms unfold. The first is the company's own readings on this measure over sixteen years, with the band the row matched shaded (the 263 days) and today's reading marked inside it, which is where the percentile on the row comes from.
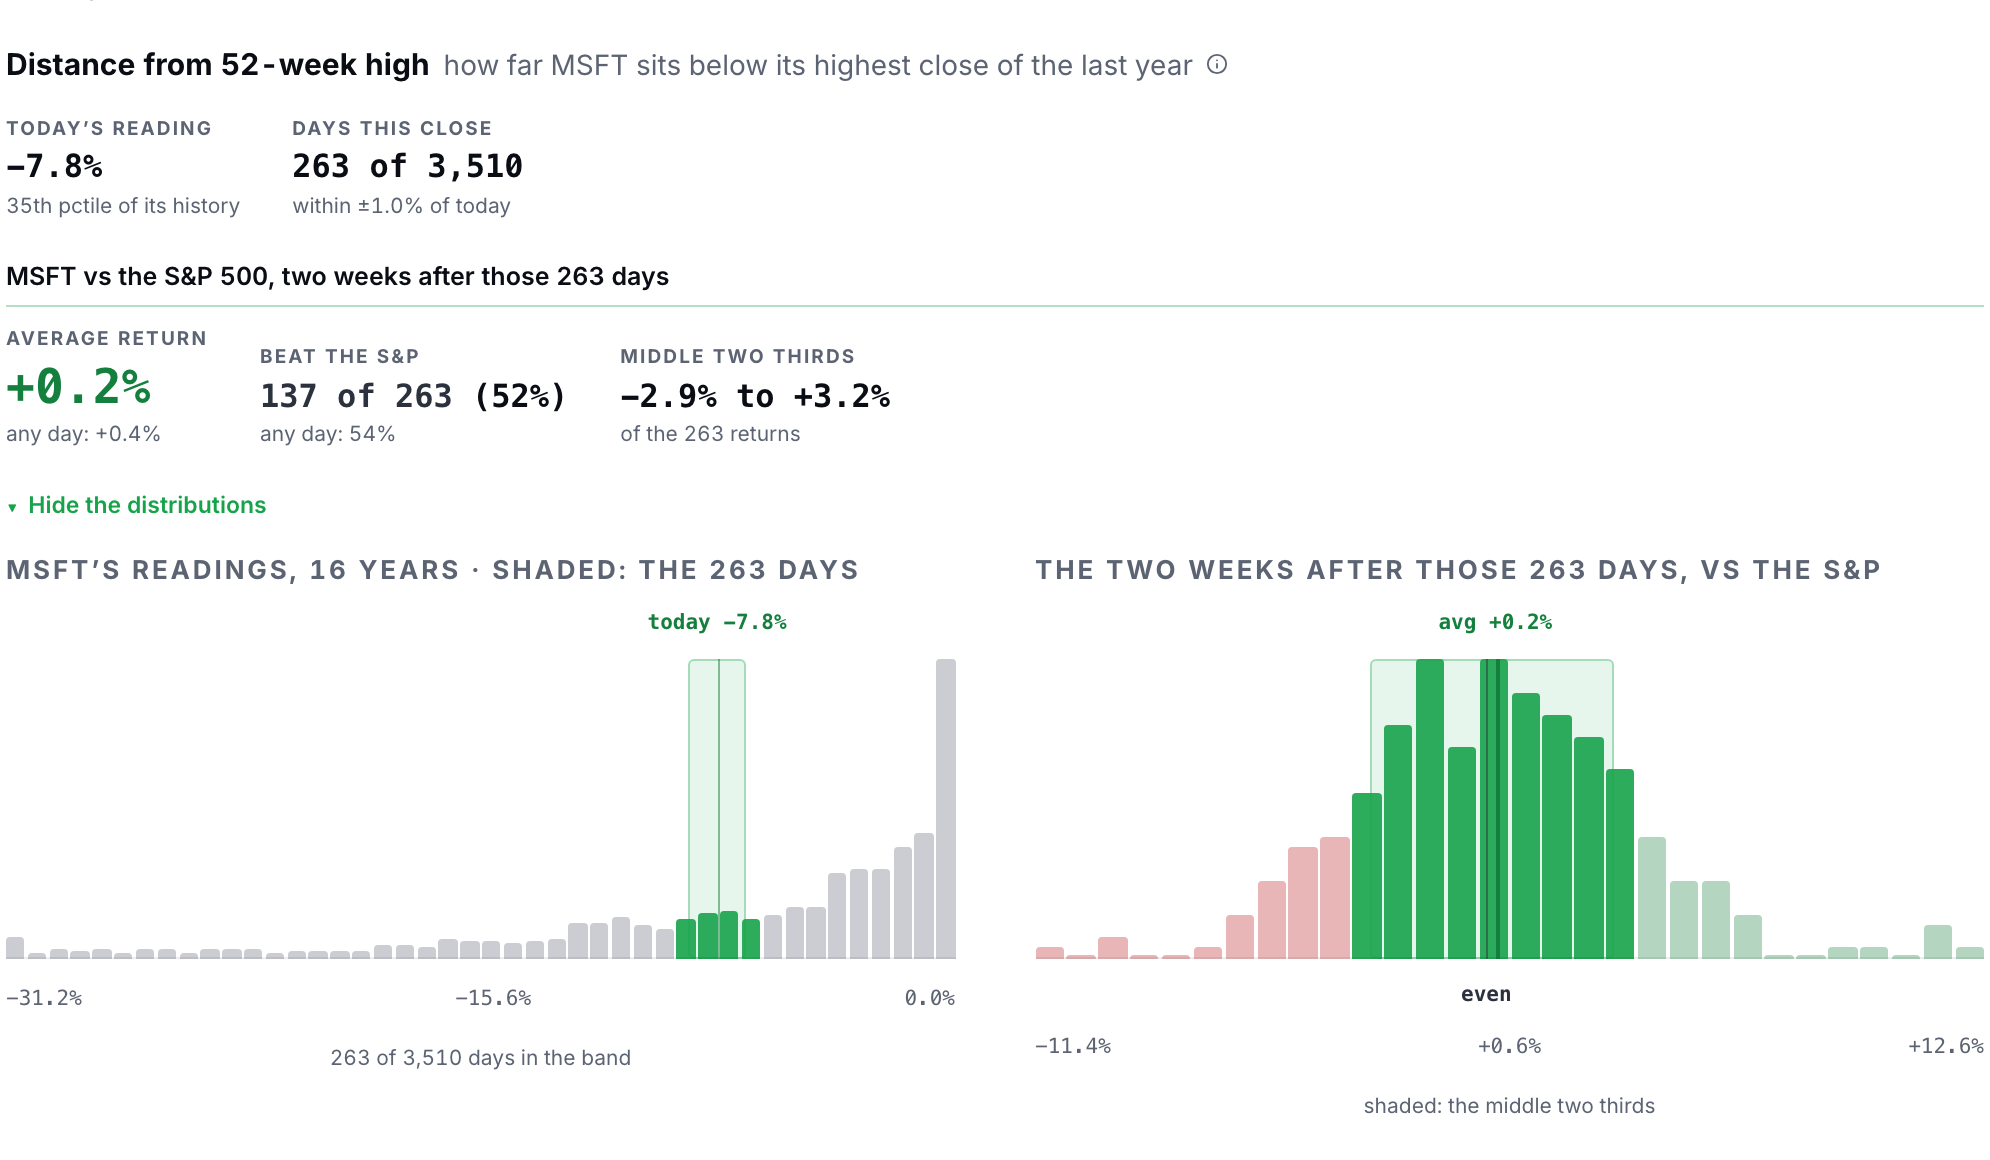
Look at the shape before moving on. For a distance from a high, the bars pile up near zero, because a stock spends most of its time near its high, and today's minus 7.8 percent is in the 35th percentile, closer to the high than most days but not near it.
The second histogram is the one the row's percentage was built from. It shows the two weeks after those 263 days against the S&P, one bar per slice of outcome, red to the left of even and green to the right, with the average marked and the middle two thirds shaded. The page gets that middle span by sorting the 263 returns and dropping the best sixth and the worst sixth, so it is built from the actual outcomes rather than from a mean plus or minus a standard deviation, and the two only agree when outcomes follow a well-behaved bell curve, which two-week relative returns do not.
Now look at how wide the red and the green actually are. The outcomes run from about minus 11 percent to plus 13 percent against the index, and the average is two tenths of a point, so the edge the row reported is small next to the spread around it.
Keep that picture in mind when you set the slider. A 52 percent on 263 days is barely different from a coin, a rate measured on a few hundred days has an error bar of about six points either way, and both of those are why the row prints counts and pictures rather than a percentage with a decimal on it, and why you should never move your number by more than the error bar allows.
The bench prints a warning in two places, and you should read it before you trust any row. Days like today are not independent evidence, because a stock that sat at one reading for a few weeks contributes those weeks over and over as the window slides forward one day at a time, and a row that matched 38 days in 3 separate runs inside two years is closer to 3 pieces of evidence than to 38, however good its percentage looks.
The years a row's days cover are printed on the What it adds up to band and on every When events overlap result, and the count turns red when the days bunch into a few years. Read the years before the percentage. When they are few, move the slider less.
What it adds up to
The second band, What it adds up to, lays every measure on the bench out on one line each, and each line says the same thing in the same words, which is what the following two weeks did against the S&P the last times this company was where it is now.
Each line shows the average two-week move, the days that finished ahead out of the days matched, and the years those days cover, with a line for any day at all beneath them for comparison. At the foot of the column is an equal-weight average of the lines, labeled as just that, and a line whose days are bunched into a few years is printed in red so that you see it before you weigh it. Press a measure's name and the same definition, formula and charts open that the Open button under its row opens, with arrows across the measures you picked, and the small ⓘ next to each band's title says what the band is and how to read it, which is where the page keeps that sort of note rather than in fine print underneath. The band has an Expand of its own, and so does When events overlap, each opening at full screen in the same frame as the cards.
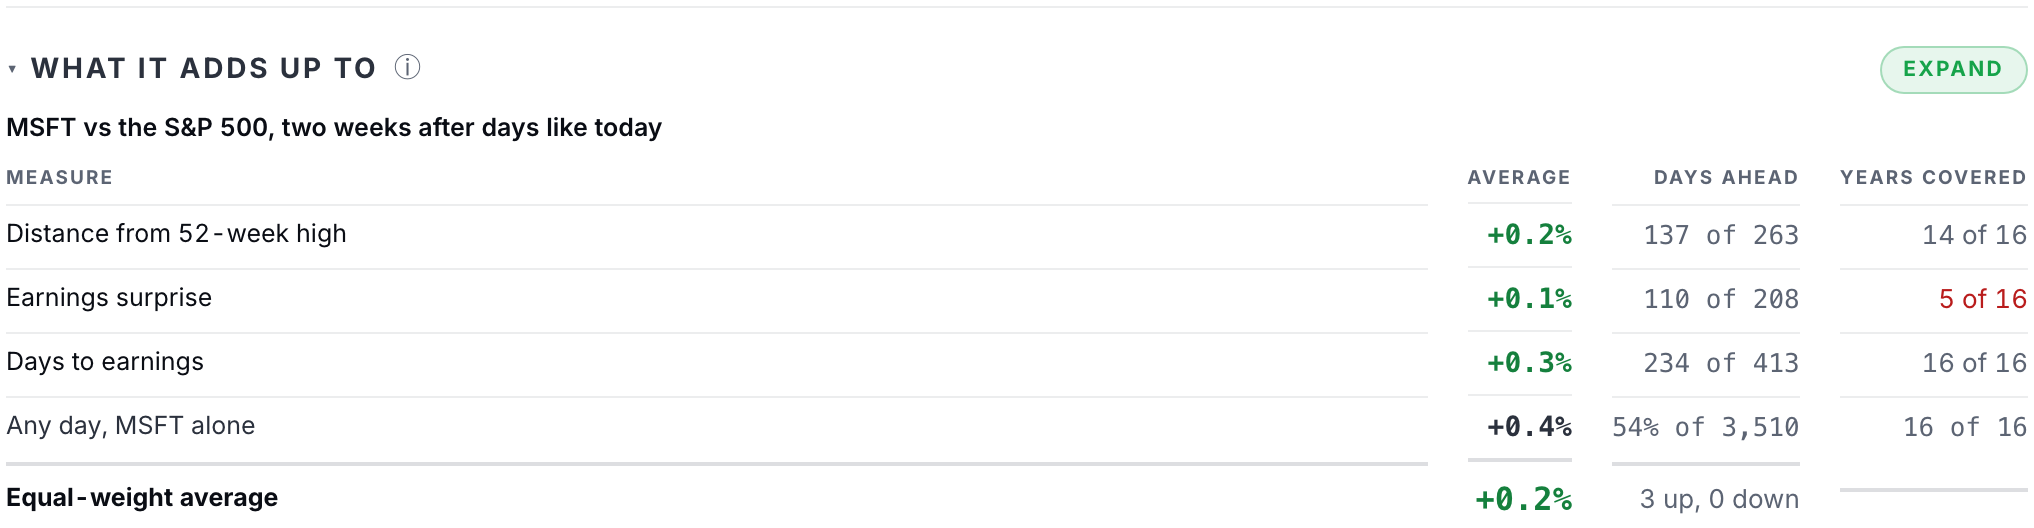
Take a moment to think about what that band does not do. It does not combine the lines into a single probability, and the reason is that the measures overlap heavily.
Three trend rows are largely one fact about the stock said three ways, and a row on the distance from the high, a row on the distance from the 200-day average and a row on six-month momentum will often agree with each other for the simple reason that they are looking at the same price path. Summing or averaging them into one forecast would count the same story three times and hand you a number that looks like an answer.
So the page shows you the column and leaves the weighing to you. The "Why?" box is where you write which lines you leaned on and which you set aside, and two weeks later the replay will show that column just as you saw it next to the number you chose.
The figure above is the band on the live page with the three rows we picked in it, and here is how to read it. Find the lines that overlap first, because the band marks them as mostly one measure counted twice.
Then compare each line with the any-day line under it. If the trend lines all show a small positive average and a days-ahead count just above half, while the any-day line shows the same, the column is telling you that the stock's own history is close to its base rate, and it is telling you that once rather than three times. A number a point or two either side of the base rate has that column behind it. A number of 60 does not, and if you want to say 60 anyway, the "Why?" box has to give a reason that is not in the column.
Group the lines that are saying the same thing, weigh what is left, check every line against the base rate and the years, and let the slider move only as far as the evidence that survives that reading. The line under the workbench is for searching the history past what the rows say.
When events overlap
The line under the workbench is the search, and nothing in it stops you once it is open. When events overlap appears once two measures are on the bench, and it opens with those measures as its conditions, each near where it is today, which means that the search starts from the evidence you already chose rather than from a blank. It lets you stack up to three conditions, each stated in percentiles of the company's own range so that nobody has to know what fourteen percent above a 50-day average means.
You pick a measure and say "near where it is today," "in its top 20 percent," or "in its bottom 20 percent," add a second and a third if you like, and the bench returns every session in fifteen years where all of them held at once, along with what the following two weeks did against the S&P.
The result shows the same things a row shows, the days that match and the span of dates they come from, how many finished ahead of the index, the median two-week move, the years they cover, and one thing more, which is the split. Every query is reported twice, once on the days before a cut year and once on the days since, side by side.
The split is there because a search has a property that a single row does not. As you searched, you kept whatever looked good and dropped whatever did not, and if you test twenty conditions, about one of them will look special by pure luck, and the one you remember afterward will be that lucky one.1
A setup that shows up in both halves of the history has passed one real test. A setup that appears only in the half you searched has not been tested, and the result says so. Read the split before the setup, and if the recent half is empty or points the other way, the setup is a story about the past rather than a claim about the next two weeks.
Let's run one. The figure below is the result on the live page. It opens on the two measures you picked, the distance from the 52-week high and the earnings surprise, each near where it is today. Keep the first and change the second to the 14-day RSI in its bottom 20 percent, which asks a plain question in the company's own terms. On the days when Microsoft sat about this far below its high and had also been sold hard for two weeks, what did the next two weeks do? Read the answer the way you read a row. The days that match and the years they cover first, then the share that finished ahead of the S&P against the any-day rate, then the median move, and only then the split, which prints the median before a cut year and the median since, side by side, with every matched day drawn as a dot along a line so you can see the spread.
Suppose the headline says 63 percent ahead on 52 days, nine points above the base rate, but the median before the cut year is +2.1% and the median since is −0.4%. That setup held in the early years and not since, so the number to use is the recent median rather than the headline.
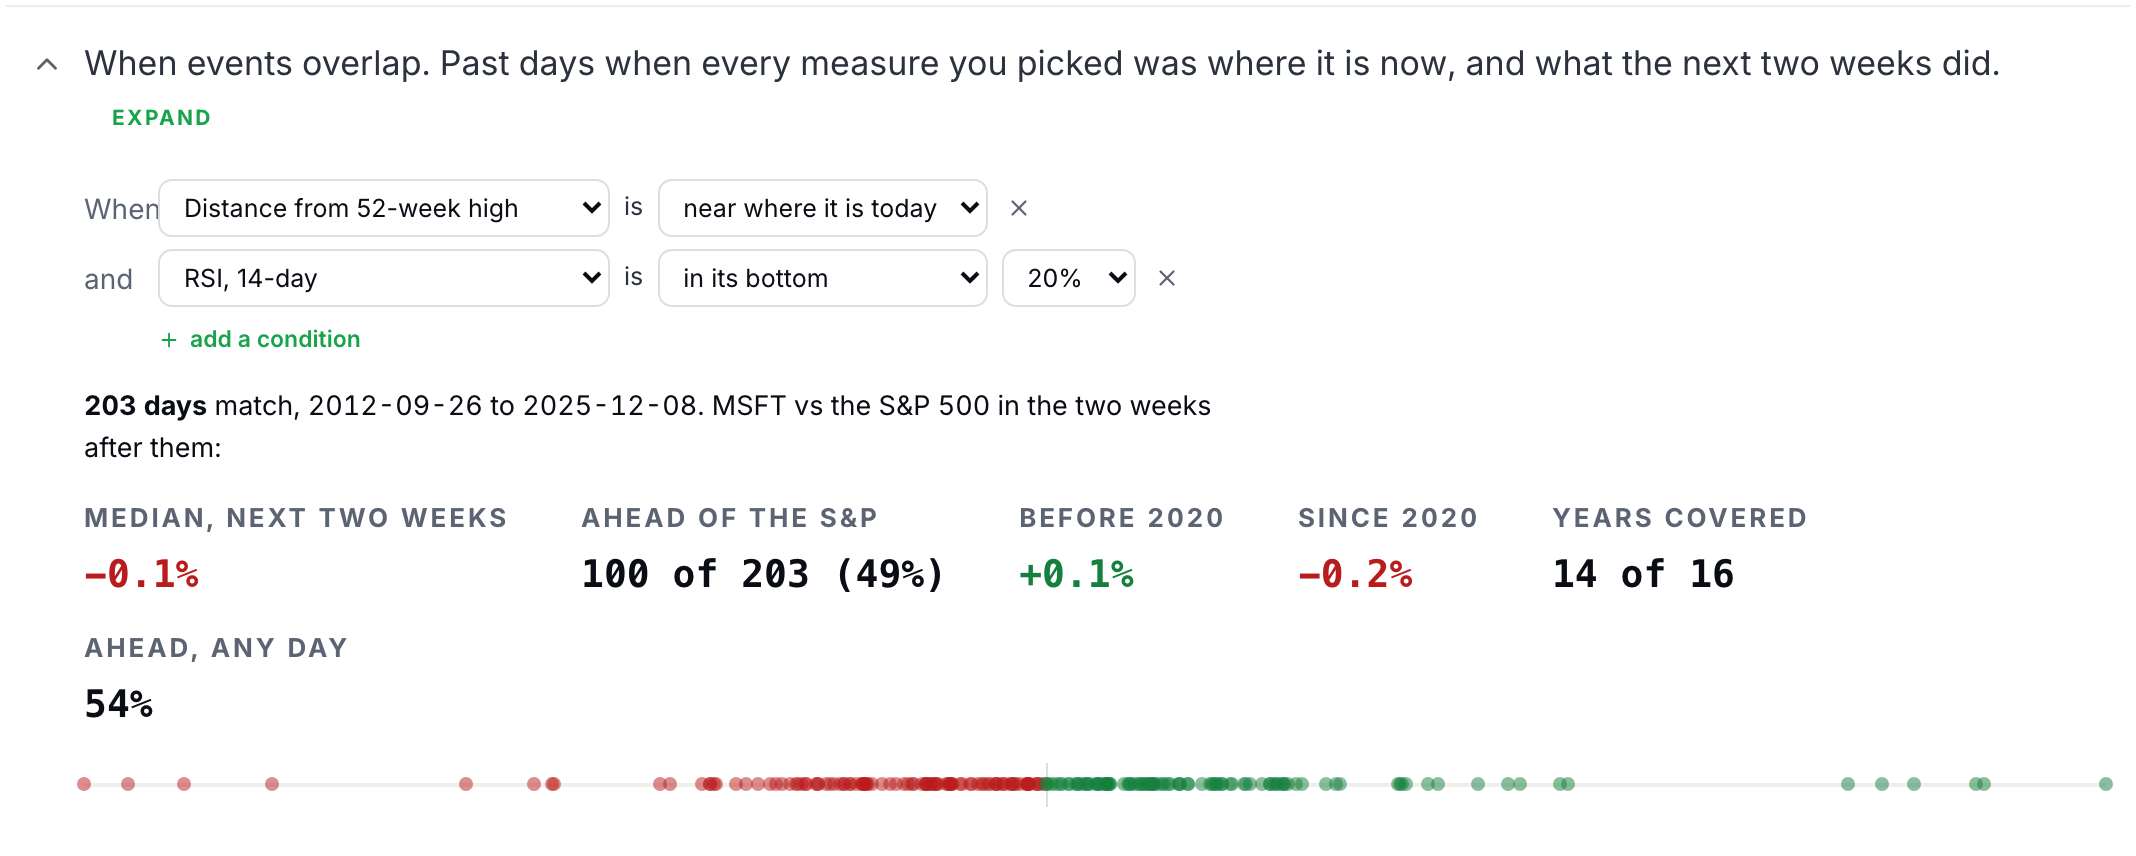
To use the line, ask a question you can say in words, read the days and the years before the percentage, and read the split before you believe anything, because only the half you did not search can confirm the setup. When the two halves agree you have earned a few points on the slider and a clause in the "Why?" box. When they disagree you have learned something about the past and nothing about the next two weeks.
In most cases, the three cards are enough. The bench is for the day you have a reason to look harder, and its job on that day is the same as the three cards' job on every other day, which is to give your number a reason a reader can check, and to keep you from moving the slider further than the evidence allows.
Once you have been through the bench, look at the second box once more before you lock. If the bench moved your number, the box should state the line or the setup that moved it and the level that would take the move back, because a falsifier that states the reason is the one that can teach you something when the call goes the other way. Everything the bench adds to a call reaches your card the same way the three cards do, which is where Chapter 24 finished, and nothing about the score changes because you looked harder.
Appendix: every measure on the bench
The 40 measures below are the bench's whole catalog, grouped by the section that holds them and read from the page's own list, so the table changes when the bench does. Every one of them opens to the same row you met above, and the kind in the last column tells you how to read the count on its row, an edge only for a signal, the size of the move for a scale measure, and a plain fact for a context measure. The two-week move the first line quotes is a median of the stock's own history and belongs on that line rather than here.
The full catalog, by section
| Section | Measure | What it shows | Kind |
|---|---|---|---|
| Trend | Excess return, 1 week | Five-day return minus the part a 60-day fit attributes to the market and the sector. Positive: it rose on its own. Negative: it fell on its own. | Signal (has a direction) |
| Trend | Residual momentum, 1 year | Return from 12 months ago to 1 month ago, less beta times the market’s return over the same span. | Signal (has a direction) |
| Trend | RSI, 14-day | Average gain against average loss over the last 14 sessions. Above 70 is conventionally called overbought, below 30 oversold. | Signal (has a direction) |
| Trend | Position in 52-week range | 0% is the 52-week low, 100% the 52-week high. | Context (a fact) |
| Trend | Drawdown from 3-year high | Price against the highest close of the last three years. Zero means a new three-year high. | Context (a fact) |
| Trend | Return, 1 month | Plain price return over the last 21 trading days. | Context (a fact) |
| Trend | Return, 3 months | Plain price return over the last 63 trading days. | Context (a fact) |
| Trend | Up/down streak | Count of consecutive closes in the same direction. Positive is a run of up days, negative a run of down days. | Context (a fact) |
| Trend | Days above 200-day average | Count of consecutive closes above the 200-day average. Zero means it closed below it today. | Context (a fact) |
| Trend | Distance from 52-week high | Price against the 52-week high. Zero is at the high; −20% is a fifth below it. | Signal (has a direction) |
| Trend | Distance from 50-day average | Price against its own 50-day average. Positive: above it. Negative: below it. | Signal (has a direction) |
| Trend | Return vs sector, 2 weeks | Ten-session return against the sector fund rather than the whole market. | Signal (has a direction) |
| Trend | Volume ratio, 5d/60d | Average dollar volume over the last five sessions divided by the last sixty. 1.0× is normal; 2.0× is double. | Signal (has a direction) |
| Trend | Excess return, 3 months | Sum of daily residuals from the market-plus-sector fit over the last 60 sessions. | Signal (has a direction) |
| Trend | Residual momentum, 6 months | Return from 6 months ago to 1 month ago, less beta times the market’s return over the same span. | Signal (has a direction) |
| Trend | Distance from 200-day average | Price against its own 200-day average. Positive: above it. Negative: below it. | Signal (has a direction) |
| Trend | Distance from 52-week low | Price against the 52-week low. Zero is at the low; +50% is half again above it. | Signal (has a direction) |
| Trend | Days since 52-week high | Sessions since the most recent 52-week high close. Zero means today is the high. | Signal (has a direction) |
| Trend | Up days, last 20 | Up closes as a share of the last 20 sessions. | Signal (has a direction) |
| Earnings & analysts | Earnings surprise | The last report’s beat or miss against consensus, divided by the standard deviation of the previous eight surprises. +2.0 is a beat twice the usual size. | Signal (has a direction) |
| Earnings & analysts | EPS, trailing 12 months | Sum of the last four quarterly reported EPS figures. | Context (a fact) |
| Earnings & analysts | EPS growth, year on year | Trailing twelve-month EPS against the same figure four quarters earlier. | Context (a fact) |
| Earnings & analysts | P/E, trailing | Split-adjusted price divided by trailing twelve-month EPS. Days with negative or near-zero earnings are left out. | Context (a fact) |
| Earnings & analysts | Revenue growth, year on year | Trailing twelve-month revenue against the same figure four quarters earlier. | Context (a fact) |
| Earnings & analysts | Revenue surprise | Reported revenue for the most recent quarter divided by the estimate going into it, minus one. | Context (a fact) |
| Earnings & analysts | Earnings beats, last 4 | Count of beats among the last four quarterly reports, 0 to 4. | Signal (has a direction) |
| Earnings & analysts | Days since earnings | Sessions since the most recent earnings report. | Context (a fact) |
| The two weeks ahead | Idiosyncratic volatility, 2 weeks | Standard deviation of the daily residual from a 60-day market-plus-sector fit, scaled to ten sessions. Sizes a two-week call; no direction. | Scale (sizes the move) |
| The two weeks ahead | Beta to the S&P | Slope of the stock’s daily returns on the S&P’s over the last 60 sessions. 1.00× moves one for one; 2.00× moves twice as far, both ways. | Scale (sizes the move) |
| The two weeks ahead | Days to earnings | Sessions until the next scheduled report. Ten or fewer means the report lands inside a two-week call. | Context (a fact) |
| The two weeks ahead | Dollar volume, 20-day | Average of shares traded times price over the last 20 sessions. Plotted on a log scale. | Context (a fact) |
| The two weeks ahead | Dividend yield | Twelve months of declared dividends divided by the split-adjusted price. Zero for a non-payer. | Context (a fact) |
| The two weeks ahead | Realized volatility, 20-day | Standard deviation of daily returns over 20 sessions, annualised. | Context (a fact) |
| The two weeks ahead | Beta to sector | Slope of daily returns on the sector ETF over the last 60 sessions. Near 1.00× it moves with its sector; well below, it moves independently of it. | Context (a fact) |
| The two weeks ahead | Gap frequency | Opens more than one percent above or below the previous close, as a share of the last quarter’s sessions. | Context (a fact) |
| The two weeks ahead | Days to ex-dividend | Sessions until the next ex-dividend date on record. The price drops by about the dividend that day. | Context (a fact) |
| The two weeks ahead | Volatility ratio, 20d/60d | Above 1.00× it has been moving more than its recent norm; below, less. Sizes the risk; no direction. | Scale (sizes the move) |
| The two weeks ahead | R² to market and sector | R² of daily returns on the market and sector over 60 sessions. High: it moves with the tape. Low: it moves on its own news. | Scale (sizes the move) |
| The two weeks ahead | Average daily range, 14-day | Average of (high − low) ÷ close over 14 sessions. Sizes the intraday move; no direction. | Scale (sizes the move) |
| The two weeks ahead | Downside/upside volatility | Standard deviation of down-day returns divided by that of up-day returns. Above 1.00×: down days are larger. | Scale (sizes the move) |
Core measures are the ones each section's menu lists first; the rest are under them in the same menu.
Sources
- Sullivan, R., Timmermann, A., and White, H. (1999). Data-snooping, technical trading rule performance, and the bootstrap. Journal of Finance, 54(5), 1647-1691 https://doi.org/10.1111/0022-1082.00163
The Analyst's Handbook is Sifter's textbook for student investors, written by Matt Lang and Bree Lang. Sifter is free for students. This chapter as markdown.