Chapter 19: Charts and technicals
EMA, RSI, MACD, Bollinger: what the indicators compute.
By Matt Lang and Bree Lang · About the authors
Where this is on Sifter: Research · Charts
Open the Charts surface and take a look at what it draws. Each bar on the chart is a candlestick, a shape that packs the open, the high, the low, the close and the volume into a single mark, and next to the price is a toolbox of indicators, which are lines computed from the price's own history and drawn over it. Our goal in this chapter is to learn what each of those lines computes, because an indicator you cannot compute is an indicator you cannot argue with, and arguing with indicators is at least half of their value. The lines come in three bundles the chart calls lenses, Trend (EMA 20, EMA 50 and VWAP), Momentum (RSI and MACD) and Volatility (Bollinger Bands and ATR), and each lens is only a switch that turns its members on together. You can add or drop any one of them by hand.
Before we write down a single formula, we need one framing rule, and everything after it depends on it. Indicators describe recent price behavior in a compact form, and they do not predict anything. In other words, use an indicator the way a doctor uses a thermometer, which is to characterize the patient's present condition rather than to forecast next week's. The analogy is a bit of a stretch (nobody argues with a thermometer), but it will keep you from asking these lines to do a job they were never built to do. While we are here, notice the small badge on the chart telling you that prices run 15 minutes delayed. An instrument that labels its own latency is being straight with you about what it can see, and you should expect the same from every instrument you rely on. The figure below is the chart with the Trend lens switched on: the badge in the header, the three lens buttons on the row under the range picker, six months of daily candles with the volume bars beneath, and the two EMAs and the VWAP line laid over the candles.
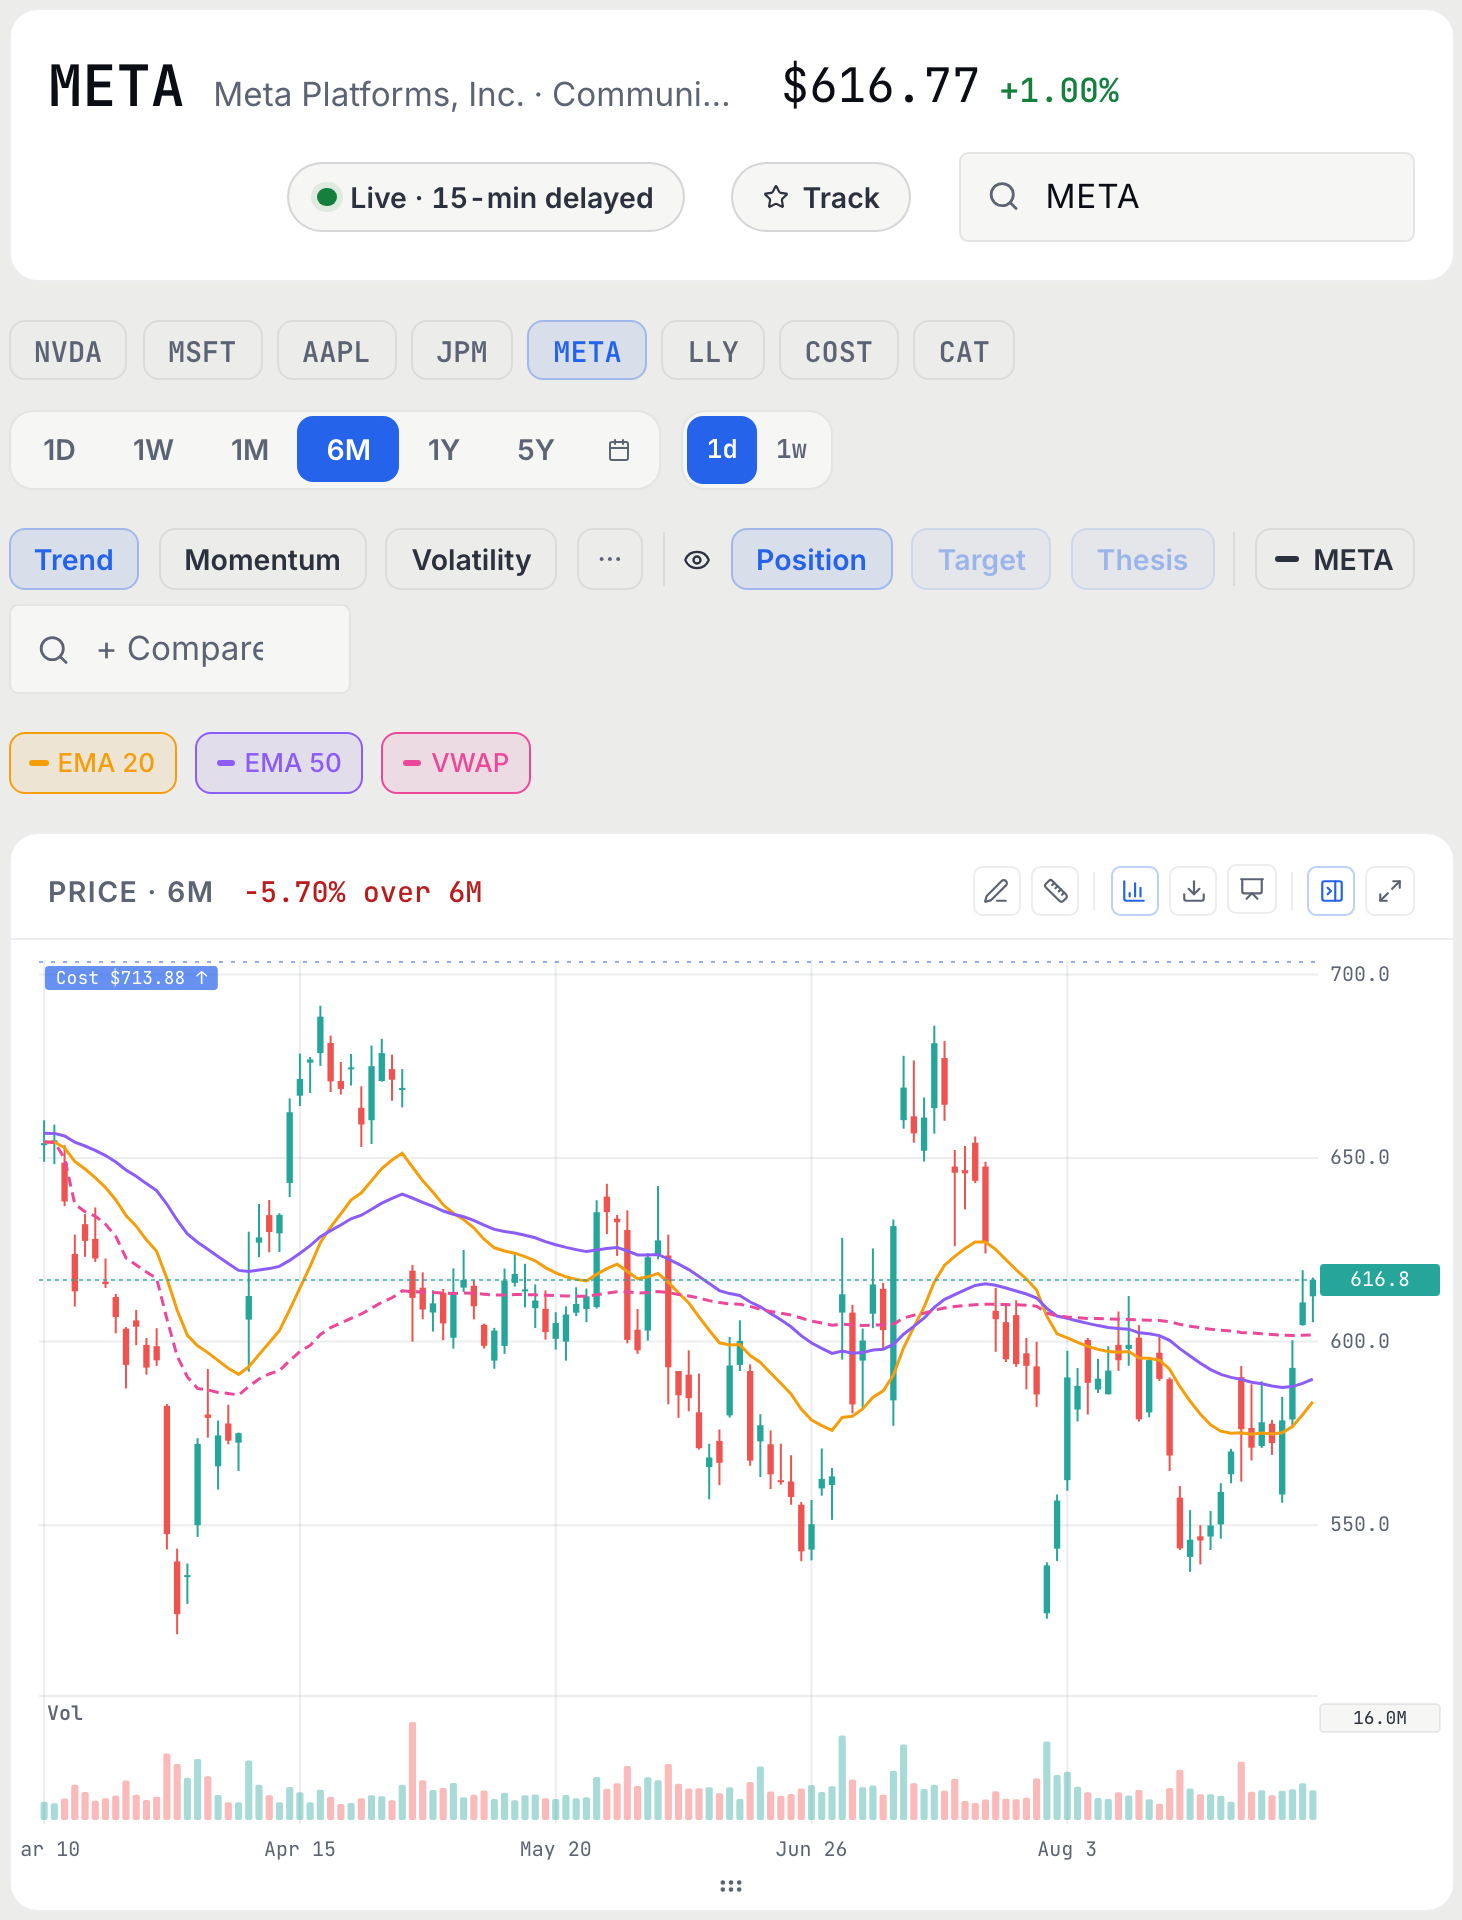
The Trend lens is built on moving averages, so that is where the formulas start. A moving average replaces each day's price with an average of recent prices, which smooths the jagged line into one you can see the direction of, and the two kinds on the chart differ only in how they weight the days.
Moving averages: SMA and EMA
Both smooth the price path. The simple moving average (SMA) weights all N days equally; the exponential moving average (EMA) weights today most and decays older days geometrically, so it turns faster. The Trend lens pairs EMA 20 with EMA 50: when the fast line crosses the slow one, the smoothed trend has changed direction (after the fact, by construction).
The EMA formula looks as though it needs a computer. It does not, and running it for two days by hand shows what the smoothing weight k does. With a short period the weight is large and the average follows the price closely, and with a long period the weight is small and the average barely moves.
Worked example: Worked example: a 3-day EMA by hand
Let's run the EMA formula by hand with N = 3, which makes the smoothing weight k = 2/(3+1) = 0.5. This means that today's price counts for half of the new average and everything that came before counts for the other half. Seed the EMA at 100 and watch how it moves.
- Day 1: price 104 EMA = 0.5 × 10⁴ + 0.5 × 100 EMA = 102. Halfway to the new price in one day. An SMA(3) would still be dragging two old closes along.
- Day 2: price 98 EMA = 0.5 × 98 + 0.5 × 10² EMA = 100. Two days of whipsaw and the EMA is back where it started, which is the smoothing doing its job.
Continue the example for one more day yourself before we go on, because the third day shows something the first two only hinted at.
Practice
Continue the worked example one more day: price closes at 106. What is the new 3-day EMA?
Solution. 0.5 × 10⁶ + 0.5 × 100 = 103. Take a moment to notice that the EMA has still not caught the price, because each day it closes only half of the remaining distance. This means that the EMA is always chasing a moving price and never quite reaching it, which is exactly the trade between lag and smoothness that every indicator makes.
That trade shows up in the Momentum lens too, because the MACD (moving average convergence divergence) is the same formula run three times. It is EMA(12) minus EMA(26), with an EMA(9) of that difference drawn as the signal line. When the MACD line is above its signal line, the short-term average is pulling away upward from the long-term one, and that is what the indicator means by momentum. The widget below lets you change the EMA period and watch how many days late the average turns when the price does.
The man whose name keeps appearing next to these settings, J. Welles Wilder Jr., was a mechanical engineer who went into real-estate development, took up trading along the way, and in 1978 published a slim book called New Concepts in Technical Trading Systems that introduced the RSI, the ATR and several other tools.1 Take a moment to think about what has happened since. Those tools are still running on professional terminals today, this platform included, and they are still running with the original default settings Wilder picked, which is a longer run than most ideas in this business ever get. So let's see what his most famous tool computes.
RSI (Wilder, 14-day)
The relative strength index: the average up-day move divided by the average down-day move over 14 days, mapped onto a 0-100 scale. The platform averages Wilder's way, seeding with a plain 14-day average and then carrying thirteen fourteenths of yesterday's average forward each day, so the figure moves more smoothly than a fresh 14-day window would. RSI 50 means gains and losses balanced; the folk thresholds are 70 ("overbought") and 30 ("oversold"), which are descriptions of recent one-sidedness, not commands.
The formula maps a ratio of two averages onto a 0 to 100 scale, and the scale is easier to read once you have run one set of averages through it. The check below does that.
Practice
Over 14 days, average gain is 1.50% and average loss is 0.75%. Compute the RSI.
Solution. RS = 2; RSI = 100 − 100/3 = 66.7. Take a moment to interpret that number. The average up day has been twice the size of the average down day, which puts the stock in strong territory but still short of the 70 line. A useful sanity anchor is the balanced case, because equal average gains and losses give RS = 1 and an RSI of 50, which is the neutral point of the scale.
Three lines on the chart have not had their formulas yet, the two on the Volatility lens and the VWAP on the Trend lens. Each is a small variation on something you already know, so one box covers all three.
With every line on the chart accounted for, the framing rule from the start of the chapter can be tested. The question below is the one every new chart reader gets wrong once.
Check yourself
A stock's RSI hits 78. The defensible conclusion is:
- It will pull back soon: overbought means a reversal is due. An RSI above 70 describes a recent stretch of trading that leaned heavily to the upside, and that is all it describes. Strong stocks can hold an RSI above 70 for months at a time, so "due" is a feeling rather than a mechanism.
- The last two weeks were heavily one-sided to the upside; nothing more. (correct) Right. The description is genuinely useful, because it tells you that the entry is crowded and that recent buyers are unstressed. However, what happens next requires a thesis about the business or the flow, and a threshold on a chart cannot supply one.
- The data is stale because of the 15-minute delay. A 15-minute delay is a real concern when you are executing a trade, but it barely registers inside an indicator built from 14 days of closes, so latency is a problem for execution rather than for the RSI.
The lab puts the lag you computed by hand onto a real chart, where it shows up as the distance between a turn in the price and the crossover that reports it.
Lab: Lab: find the last crossover
- Open Research › Charts, load one of your holdings and apply the Trend lens, which draws EMA 20 and EMA 50 with a VWAP line alongside.
- Find the most recent date on which the fast EMA crossed the slow one, and note the direction of the cross.
- Now look to the left of the crossover and ask yourself how long after the actual turn in price the cross printed. That lag is the price of smoothing, and it is the reason crossovers confirm trends rather than call them.
- Switch to the Volatility lens (Bollinger + ATR) and check whether the bands are wide or narrow compared with the past year. Connect what you see to Chapter 5, because wide bands are high rolling volatility, drawn instead of tabulated.
Sources
- Wilder, J. W., Jr. (1978). New Concepts in Technical Trading Systems. Trend Research, Greensboro, NC https://archive.org/details/newconceptsintec00wild
- Bollinger, J. (2001). Bollinger on Bollinger Bands. McGraw-Hill https://www.bollingerbands.com/bollinger-band-book
The Analyst's Handbook is Sifter's textbook for student investors, written by Matt Lang and Bree Lang. Sifter is free for students. This chapter as markdown.