Chapter 18: Quality scores
Earnings Quality and Capital Allocation: useful heuristics with limits.
By Matt Lang and Bree Lang · About the authors
Where this is on Sifter: Research · Ticker · Earnings + Capital
Load a ticker in Research and two of the tabs will hand you something that looks a great deal like a report card. The Earnings Quality tab and the Capital Allocation tab each grade the company with a letter (A through F on the first, and A+ through D on the second), and each letter is assembled from a small set of sub-scores underneath it. Before we open either tab, one warning from the methodology needs to come first. These grades are proprietary heuristics, not standardized metrics. No accounting standard stands behind them, and two data vendors handed the same company would come back with two different letters. This may make the scores sound flimsy, and it is healthy to hold on to some of that skepticism, because a score like this is useful as a well-organized set of questions to ask about a company, and it gets an analyst into trouble the moment it is read as a verdict.
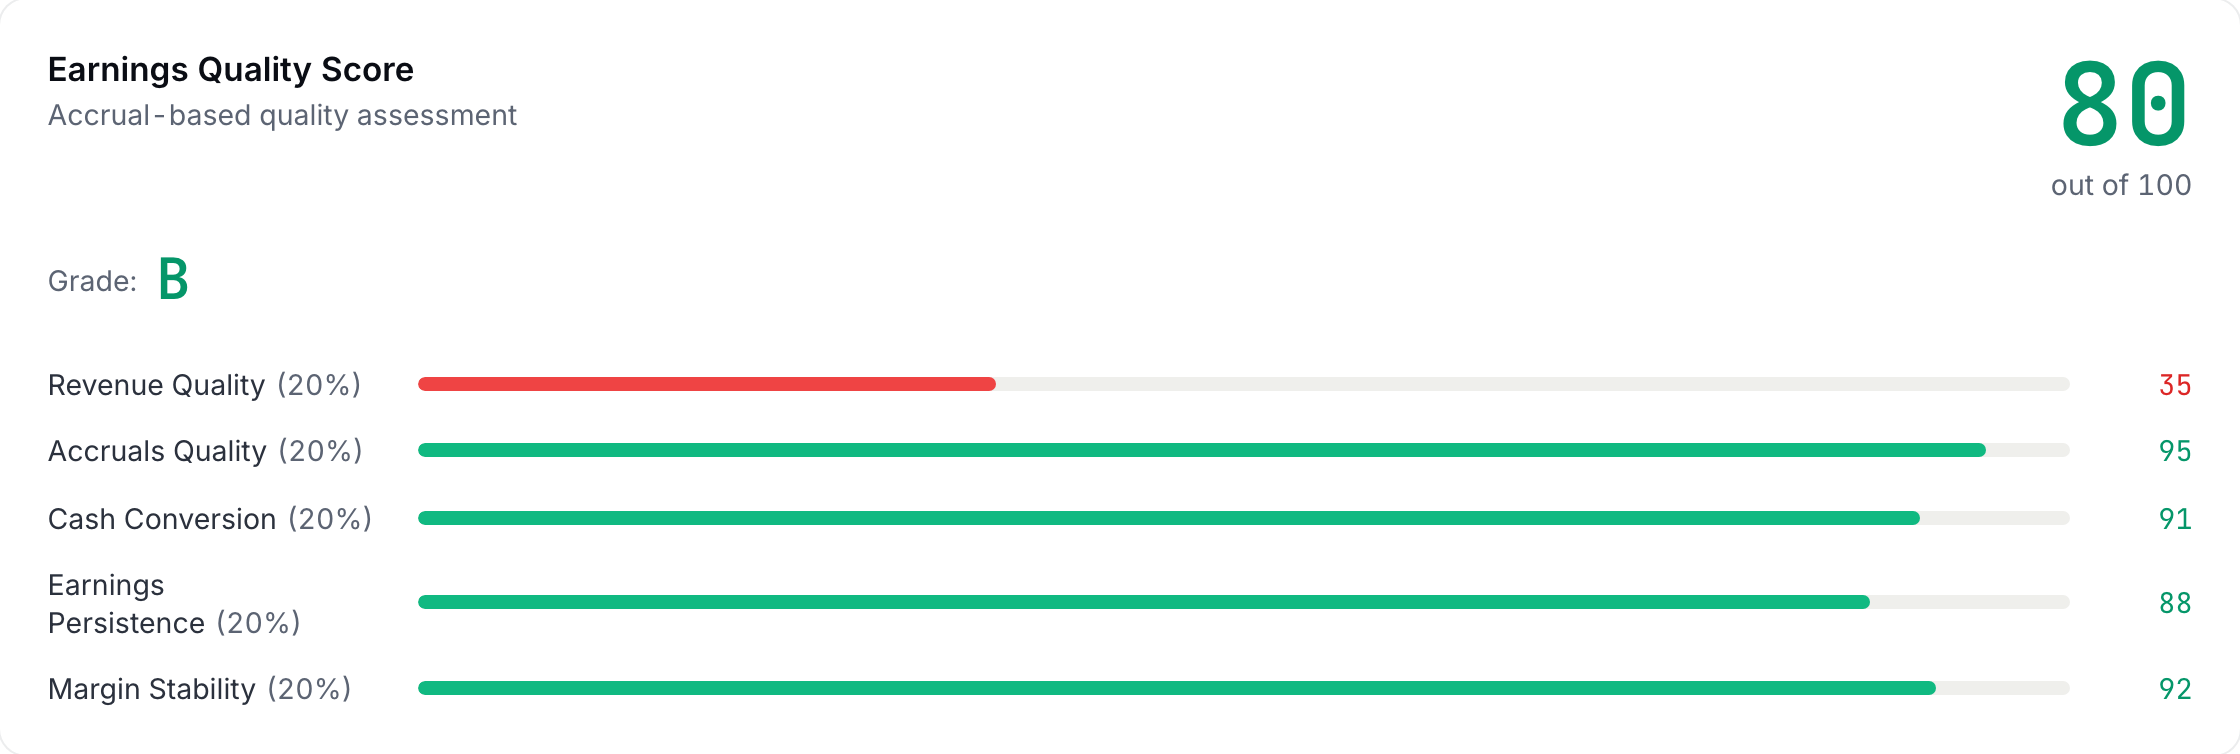
The Earnings Quality score is organized around the question auditors have been asking for as long as there have been audits. Is the reported profit real? Five sub-scores approach that question from five directions, each runs from 0 to 100, and the headline score is simply their average, less five points for every red flag the scanner beneath them raises (although it never drops below 20). The one to read first is accruals quality, which asks whether net income is backed by cash that actually showed up or by working-capital IOUs, and the platform measures it as net income minus operating cash flow, scaled by total assets, so that a company whose cash flow runs ahead of its profit scores high and one whose profit runs ahead of its cash scores low. The emphasis is not an accident, because when researchers sorted the market on accruals, the accrual-heavy half went on to earn lower subsequent returns, apparently because investors read a dollar of accrual profit as though it were a dollar of cash.1 This means that the market has a documented habit of treating profit on paper and profit in the bank as the same thing, and the sub-score exists to keep you from picking up the habit yourself.
The other four round out the picture. Revenue quality asks whether revenue grows steadily or lurches around, measured as the variability of quarter-to-quarter growth, since a company whose sales cannot be predicted is a company whose profits cannot be predicted either. Cash conversion asks how much of each dollar of net income arrives as operating cash flow, and the tab puts two related tiles next to it, a cash earnings ratio (operating cash flow over net income) and an FCF conversion (free cash flow over net income), both summed over the last four quarters, and we will walk through that arithmetic ourselves below. Earnings persistence asks whether net income has stayed positive and kept growing quarter after quarter, and margin stability asks whether the net margin holds still or wanders. Below the five is a red-flag scanner with eight checks, and five of them are computed from the quarterly statements. Three of those compare the latest four quarters with the earlier ones, raising a flag when receivable days are more than 15% higher, when inventory is more than 25% higher, or when the gross margin is more than 5% lower in relative terms (an average margin that slips from 40% to 37.5%, for example, is 6.25% lower and trips the flag). The other two look at levels, raising a flag when accruals average more than 3% of total assets, or when operating cash flow came in below 80% of net income in each of the last three profitable quarters. Each flag raised costs the headline five points, and we will come back to the remaining three checks after the arithmetic. The figure below is the card on the sample book's Apple page, and it makes the point about reading the parts rather than the letter: a B overall, four sub-scores in the nineties and eighties, and revenue quality at 35, because Apple's quarters swing with its product cycle and the sub-score only asks how steady the growth is, not how large.
Of the five, cash conversion is the one we can rebuild by hand from nothing more than four quarters of two numbers, so let's do that first. The tab's FCF Conversion tile is free cash flow over net income, both summed over the trailing twelve months, and the worked example builds it for an imaginary company.
Worked example: Worked example: FCF conversion over four quarters
Let's build the tab's FCF Conversion (TTM) tile ourselves. Imagine a company that reports four quarters of net income of 50, 60, 55 and 35 ($M), and free cash flow over the same four quarters of 30, 40, 35 and 15.
- Sum both streams Net income: 50 + 60 + 55 + 35 = 200. FCF: 30 + 40 + 35 + 15 = 120. Four quarters smooth out timing noise (a big capex hitting one quarter, a receivable collected late).
- Convert 120 / 200 60% conversion, so each dollar of reported profit produced 60 cents of free cash. The tile colors 80% and above green and anything under 60% red, so this company is right at the bottom edge of the plain zone. What counts as good depends a great deal on the business model, since the difference between profit and cash is mostly capital intensity and working capital. A business that buys little equipment and collects quickly converts most of it, and one that builds factories and finances its customers does not. Compare a company to its own history and to businesses shaped like it, as well as to the tile's bands.
- Spot the soft quarter Q4 alone: 15 / 35 = 43%, well below the run rate. One soft quarter is a question ("inventory build? big capex? collection slip?"), not a conviction. The FCF versus net income chart lower on the tab, and the Quarterly Data section of its Verify CSV, exist so you can find which quarter is dragging and ask why.
The headline score is the average of the five sub-scores less the flags, and the check below composes one. Pay attention to what the average hides as much as to what it shows.
Practice
Compose an overall Earnings Quality score the way the tab does. The five sub-scores are revenue quality 80, accruals 60, cash conversion 70, persistence 50 and margin stability 65, and the scanner has raised one red flag. Enter the headline score.
Solution. (80 + 60 + 70 + 50 + 65) / 5 = 65, less 5 for the flag = 60, which the tab letters a D (A from 90, B from 80, C from 70, D from 60) and colors amber, since it colors a score green above 75, amber from 50 to 75 and red at 50 and below. Notice that the average has hidden where the weakness is. The 50 on persistence is what dragged it down, and that sub-score, together with whatever the flag was, is the thread to pull first.
Recall that the scanner has eight checks and that only five of them are computed. The other three (revenue recognition, capitalized costs and related-party dealings) never show a green tick. They are marked not checked, with a question mark and a pointer to the notes in the 10-K, and the reason is that the statement figures cannot answer them. The income statement tells us how much revenue a company booked in a quarter, but it does not tell us when in the life of a contract the company chose to book it, and two companies with identical totals can have made very different choices along the way.
Capitalized costs are the clearest example. Imagine a company that pays its software engineers $20M this year. If it expenses the pay, operating income falls by $20M right away. If it capitalizes the pay instead (records it as an asset on the balance sheet and depreciates it over, say, five years), only $4M shows up as an expense this year, and operating income comes out $16M higher. Accounting rules allow (and in some cases require) capitalizing costs like these, and the totals on the statements look perfectly normal under either treatment, which means that the only way to judge whether the choice was reasonable is to read the note where the company explains its policy. Related-party dealings (business done with executives, directors or companies they own) work the same way, since they are disclosed in a note to the 10-K and in the proxy statement rather than in any line of the statements.
Now that we have a way of asking whether the profit is real, the next question is what management does with the cash once it exists, and that follow-up is the job of the Capital Allocation scorecard. Management can reinvest a dollar in the business, spend it on acquisitions, pay it out as a dividend, use it to buy back shares or use it to pay down debt, and the scorecard grades how well those choices have been made, in five categories with fixed weights: the ROIC spread over WACC gets 40%, capital efficiency 20%, shareholder returns 15%, reinvestment quality 15% and balance-sheet management 10%, and the weighted total becomes a letter on a finer scale than the Earnings tab uses, with A+ from 95, A from 90, A− from 85, B+ from 80, B from 75, B− from 70, C+ from 65, C from 60, C− from 55, D+ from 50 and D below 50 (so there is no F on this tab).
Two of those terms come from earlier chapters and one is new. The WACC is the weighted average cost of capital from Chapter 16, the blended rate the business has to earn to satisfy its lenders and its shareholders. ROIC, the return on invested capital, is the new one. It is the operating profit the company earns, after tax, divided by the capital tied up in the business, and it answers the question of how much each dollar the company keeps actually earns. One chart on the tab outranks all the others, the plot of ROIC against the cost-of-capital hurdle. A company that reinvests at a ROIC above its WACC creates value with every dollar it keeps. Conversely, a company that reinvests below the hurdle destroys value with every dollar it keeps, even though it can look busy and ambitious to the casual observer the entire time. In other words, growth by itself tells us very little, because growth above the hurdle and growth below it point in opposite directions for the owners. The question the tab keeps in front of you is growth at what return. The figure below is that card on the sample book's Apple page: the ROIC for the latest fiscal year, the WACC, the spread between them, the economic value added that the spread times invested capital works out to, and the ROIC line drawn against the hurdle year by year.
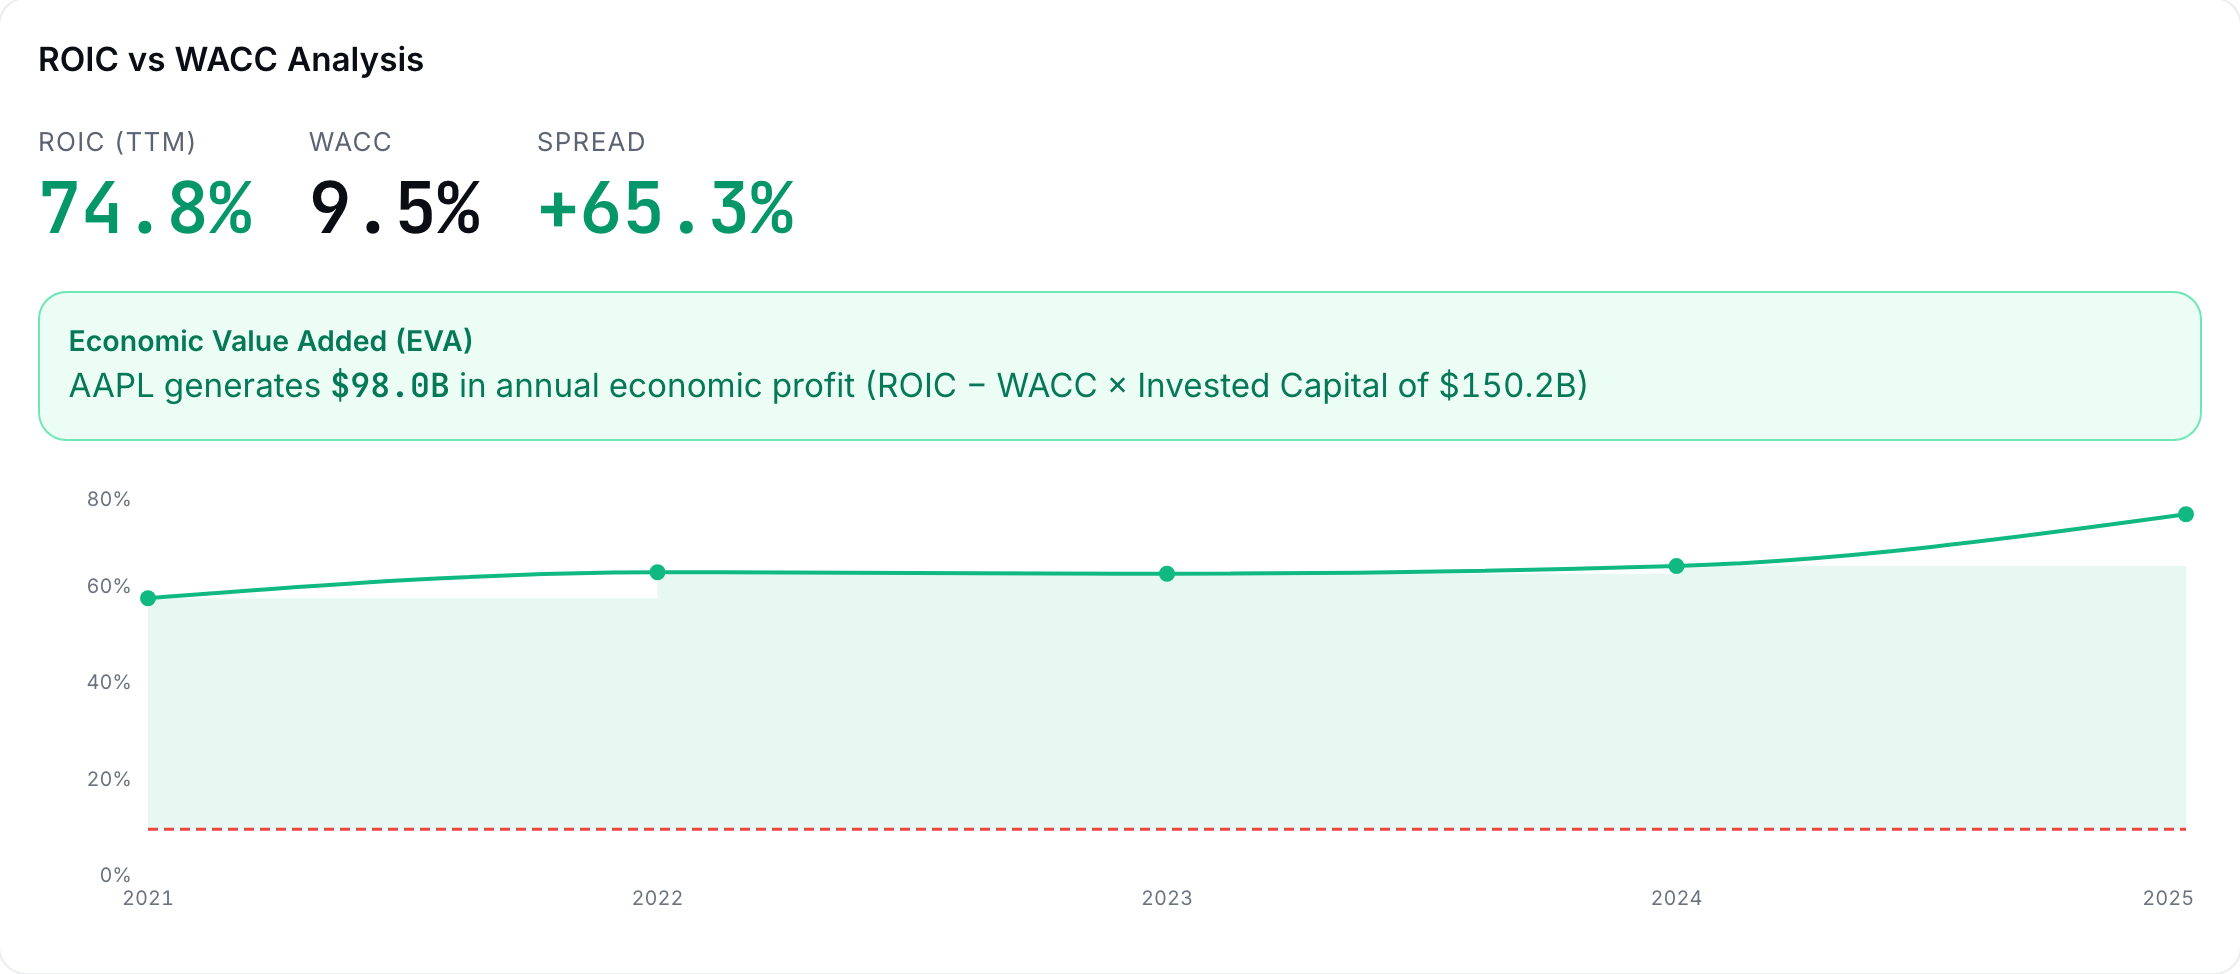
Let's pin down how the tab computes the ROIC tile, which is labeled ROIC (latest FY) because it uses the latest fiscal year from the annual statements. The numerator is operating profit after tax and the denominator is the capital the owners and lenders have put into the business, less the cash it is holding.
ROIC on the Capital tab
NOPAT is net operating profit after tax. The tax rate is the year's effective rate (21% when pre-tax income is not positive). Equity, debt and cash come from the latest fiscal year-end balance sheet, and together they make up invested capital. When invested capital is zero or negative, the tile is left blank rather than showing 0.0%.
Take a moment to think about the denominator, because it can go negative. Imagine a company that has spent years buying back its own stock, so that its book equity is now −$50M, while it has $100M of debt and $60M of cash. Invested capital is −50 + 100 − 60 = −$10M, and dividing a positive NOPAT by a negative number would give a negative ROIC for what may be a very profitable business. The tab leaves the tile blank in that case (hover the blank and it says so), and a blank here usually tells us more about years of buybacks than about how well the business earns, so look at the chart for the years when invested capital was positive before drawing any conclusion.
The hurdle on the other side of the chart is the WACC from Chapter 16, and the cost of debt inside it is the company's own interest expense divided by its total debt, which is the rate it actually pays. For example, a company paying $30M of interest a year on $600M of debt has a cost of debt of 30 / 600 = 5%. The tab holds that rate between the risk-free rate and 15%, and when a company reports no interest expense or no debt, it uses the risk-free rate plus 1.5 percentage points instead.
The ROIC test decides how to read a growth announcement, and the question below is the case that trips people up, because the announcement sounds like good news.
Check yourself
A company's ROIC has run at 7% for three years while its WACC is 9%. Management announces a major expansion, doubling capex. The Capital Allocation lens says:
- Bullish: aggressive reinvestment shows confidence. Reinvesting more at a return below the hurdle destroys value faster, not slower, so the scale of the announcement is the opposite of reassuring. Management may well be confident, but confidence does not change the return that the capital earns.
- Bearish: they are scaling up a value-destroying machine. (correct) Right. Earning 7% on capital that costs 9% loses 2 points on every dollar every year, and doubling the dollars doubles the loss. Take a moment to notice what a real bull case would have to argue here. It would have to claim that the new capex will earn above 9%, which is a claim about the project in front of the company and not about the record behind it.
- Neutral: capex decisions do not affect shareholder value. Capital allocation is the long-run driver of shareholder value, and that premise is the reason this tab exists at all.
Reinvestment is one of the five choices. Buying back shares is another, and it has its own arithmetic, which the check below runs. Watch what the scorecard grades about a buyback and what it leaves to you.
Practice
Buyback math: a company with 100M shares and $40M of annual FCF spends $200M buying back shares at $50.00. Afterward, what is FCF per share, in dollars? (Assume FCF is unchanged.)
Solution. 40 / 96 = $0.4167, up from $0.40 before the buyback, which works out to a 4.2% boost in free cash flow per share even though the business itself is not producing a dollar more of cash. Whether that boost beat the alternatives (reinvestment or paying down debt) depends entirely on the price management paid, because a buyback executed above intrinsic value transfers wealth away from the holders who remain. Be aware that the scorecard's shareholder-returns category grades whether cash actually went back to holders and kept going, whether the share count shrank by more than five percent over the window, and whether the dividend grew. It does not judge the price paid, which means that the question of whether the buyback was cheap is left to you.
The scorecard grades the company's choices year by year, and the Capital tab also has a strip titled Cost Structure & Reinvestment that describes the last four quarters in five ratios. The first one needs the most explanation. Depreciation is the accounting estimate of how much of the company's plant and equipment wore out during the period, and capex is what the company spent on new plant and equipment over the same period, so capex ÷ depreciation tells us whether the asset base is growing or shrinking. A ratio above 1x means the company is putting in new assets faster than the old ones wear out, so it is building capacity, and a ratio below 1x means it is spending less than its assets wear out, so it is running its asset base down. In other words, a ratio of about 1x means the company is spending just enough to stand still.
Neither side is good or bad by itself. A company at 2x might be building factories for demand it can already see coming, or it might be pouring money into projects that will never earn their WACC (the ROIC question from earlier in the chapter). A company at 0.6x might be a mature business collecting cash from equipment that still has years of life left in it, or it might be putting off replacements to make this year's free cash flow look better, which tends to show up later as a large catch-up bill. Because free cash flow is operating cash flow minus capex, a ratio well under 1x can also flatter the FCF conversion we built earlier in the chapter, and the capex plans in the 10-K and on the earnings calls are where we find out which story is true.
The other four ratios describe the shape of the business. Capex ÷ revenue shows how much of each sales dollar has to go back into long-lived assets, SG&A ÷ revenue is the overhead of running the business apart from making the product, R&D ÷ revenue is spending on new products and technology, and intangibles ÷ assets is the share of the balance sheet made up of goodwill and other intangible assets, which usually comes from past acquisitions and can be written down if those deals disappoint. These four are most useful against the company's own history and against the peer set from Chapter 17. The check below computes the first ratio from four quarters of figures.
Practice
Over the last four quarters a company spent $30M, $25M, $35M and $30M on capex, and it booked $20M of depreciation in each quarter. What is its capex ÷ depreciation?
Solution. Capex sums to 30 + 25 + 35 + 30 = $120M and depreciation to 4 × 20 = $80M, so the ratio is 120 / 80 = 1.5x. This means that for every dollar of plant and equipment that wore out over the year, the company put $1.50 of new assets in place, so its asset base grew. If the same company had spent only $48M on capex, the ratio would be 48 / 80 = 0.6x, and it would be replacing only 60 cents of every dollar of assets that wore out.
A low ratio is easy to compute and much harder to interpret, especially when it arrives next to a very good cash number, which is the situation in the question below.
Check yourself
Over the last four quarters a manufacturer's capex ÷ depreciation is 0.6x, and its FCF conversion has climbed to 110%. What is the most useful conclusion?
- Cash conversion is excellent, so the earnings are high quality. Be careful here. Free cash flow is operating cash flow minus capex, so spending less on equipment raises free cash flow without the business earning a dollar more. The conversion may be real, but the low ratio is a reason to check before giving it credit.
- Part of the strong free cash flow may come from spending less on equipment than is wearing out, so check the capex plans before trusting the conversion. (correct) Right. A ratio of 0.6x means the company replaced only 60 cents of every dollar of assets that wore out, and that saving flows straight into free cash flow. It could be a mature business with plenty of life left in its equipment, or it could be putting off spending that will come due later, and the capex plans in the filings and on the earnings calls are where we find out.
- The low ratio shows the company is capitalizing costs aggressively. Capitalizing costs moves spending onto the balance sheet, where it often shows up as extra capex, which would push the ratio up rather than down. A low ratio points to spending less on assets, not to recording more of the spending as assets.
That is the arithmetic behind both scorecards. The warning from the top of the chapter applies to what you do with the letters they produce.
The lab rebuilds one tile from the tab's own CSV, and then sends you to the filing to explain the weakest quarter.
Lab: CSV lab: rebuild one sub-score input
- Open Research, load a holding, and read its Earnings Quality scorecard. Note the weakest sub-score.
- Download the Earnings tab's Verify CSV. Its Quarterly Data section has Revenue, Net Income, Op Cash Flow and FCF by quarter.
- Recompute the FCF Conversion (TTM) tile yourself: SUM(FCF) / SUM(Net Income) over the last four rows, and the Cash Earnings Ratio the same way with Op Cash Flow. Both should match the tiles to the rounding.
- Find the softest single quarter and write one sentence giving a plausible, checkable cause. Then go check it in the Filings tab.
Sources
- Sloan, R. G. (1996). Do stock prices fully reflect information in accruals and cash flows about future earnings?. The Accounting Review, 71(3), 289-315 https://www.cuhk.edu.hk/acy2/workshop/June2009Wasley/1996TAR).pdf
The Analyst's Handbook is Sifter's textbook for student investors, written by Matt Lang and Bree Lang. Sifter is free for students. This chapter as markdown.