Chapter 17: Comps and Compare
Relative valuation: what cheaper-than-peers does and does not mean.
By Matt Lang and Bree Lang · About the authors
Where this is on Sifter: Research · Ticker · Comps + Research · Compare
Imagine that you are shopping for a house and you have finally found one you like, and now you want to know whether the asking price is reasonable. One way to answer the question is to work out, from the ground up, what the house is worth to you in the absolute, which is the kind of valuation a DCF performs on a business. Almost nobody prices a house that way. Instead, buyers look up what similar houses in the neighborhood have sold for recently and ask whether the asking price is out of line with those sales (real estate agents call these sales "comps", and they will happily talk about them for as long as you let them).
Comparables bring the same instinct to the stock market. Rather than asking what a business is worth in the absolute, we ask what buyers are actually paying for similar businesses this week, which is a smaller question and frequently a more useful one. In order to answer it, we assemble a peer set, line up the multiples (EV/EBITDA, P/E, forward P/E, P/S, all of which you built in Chapter 15) and see where our company stands against the peer median, the middle value of the peers' multiples. The Comps tab does the lining up for us, and the figure below shows it on the sample book's Apple page: the peer chips across the top, each company's market cap and five multiples, and the Peer Median row along the bottom that the whole chapter is about.
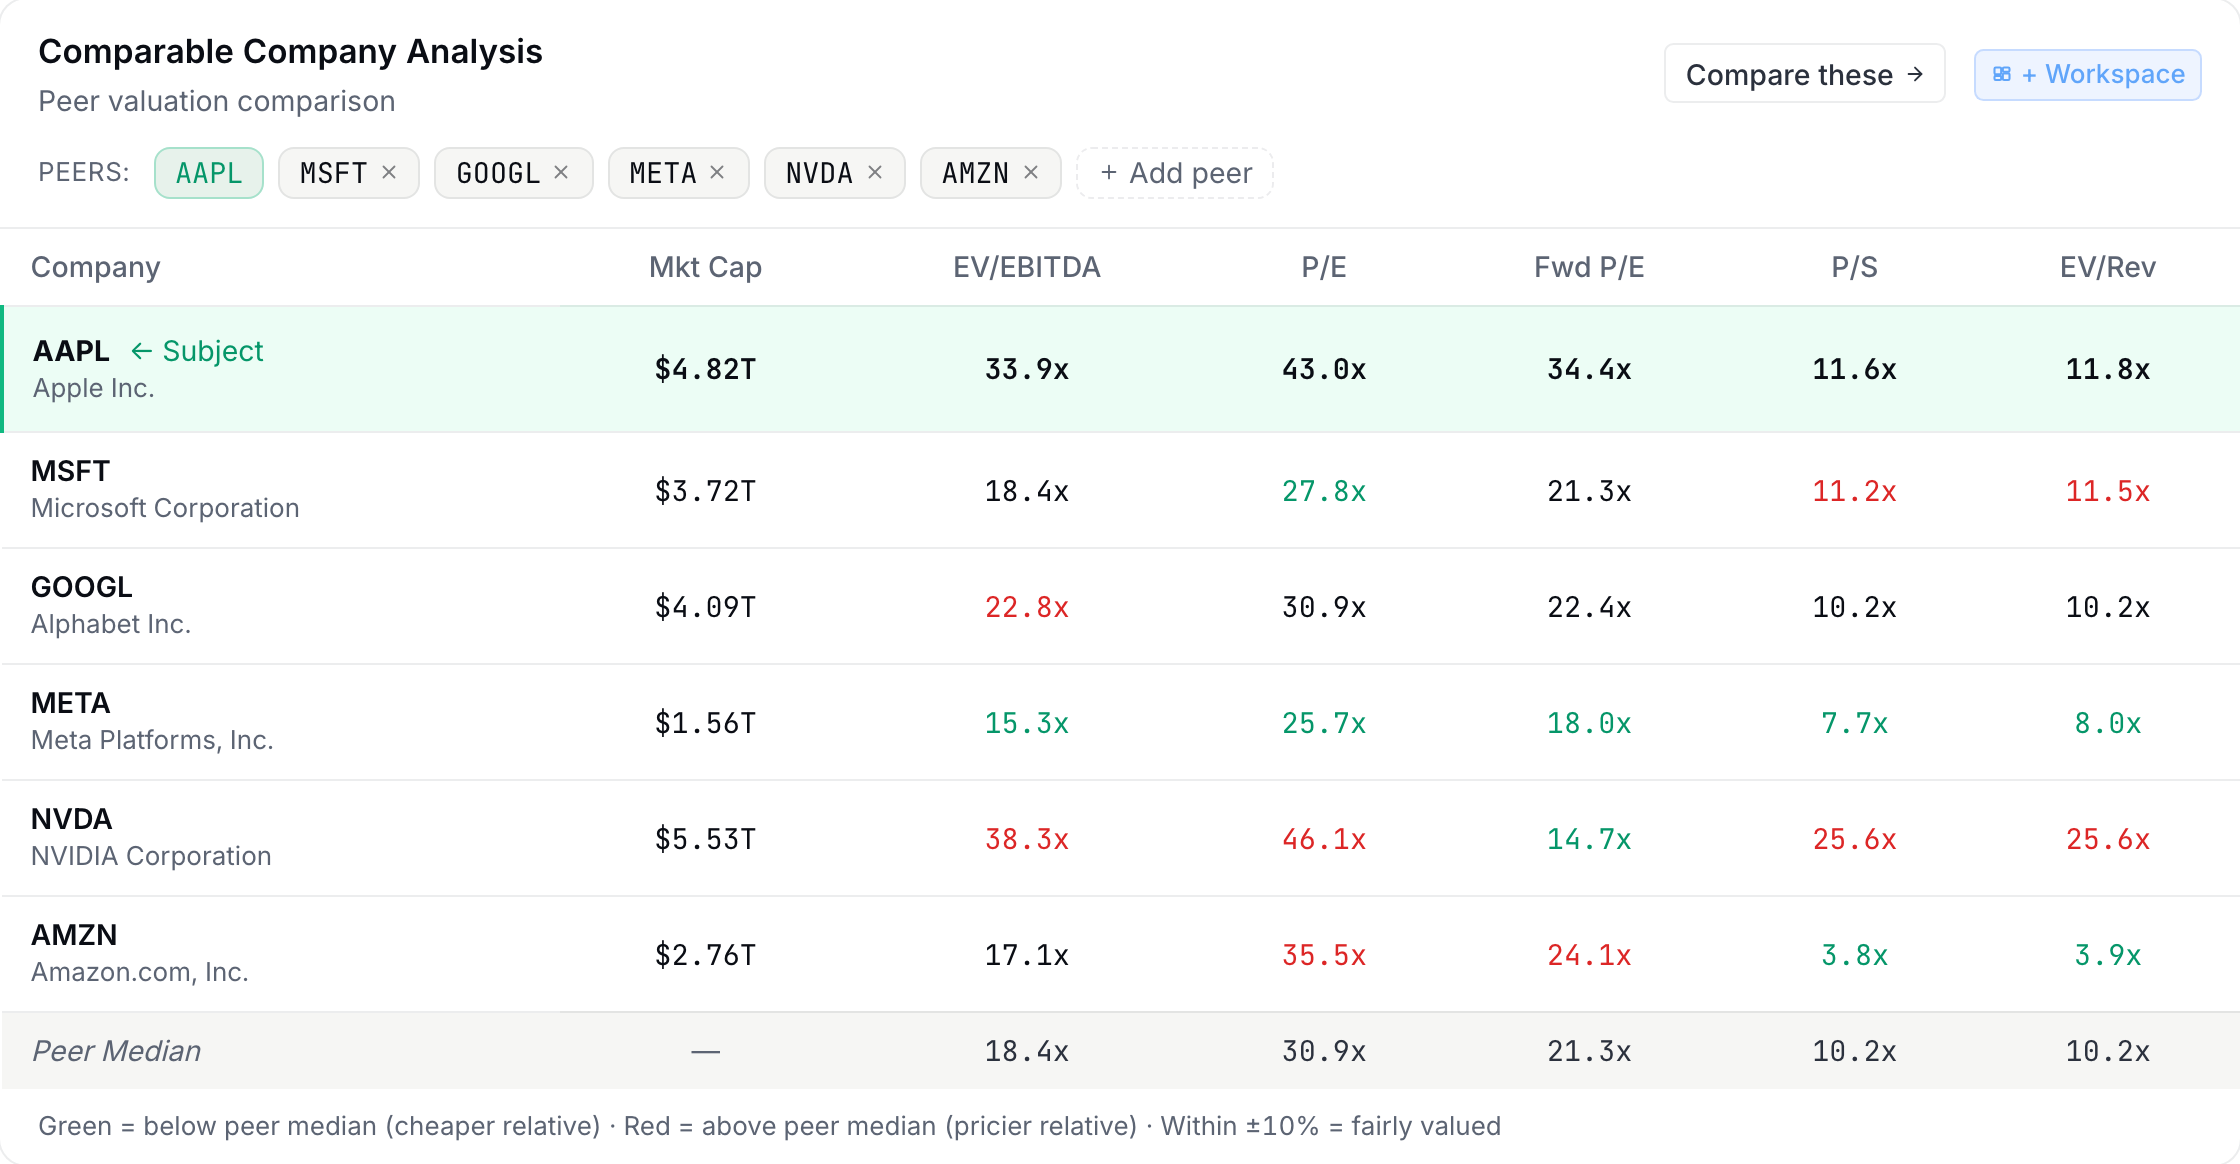
Do not mistake the speed of the table for the end of the work. The judgment is entirely ours, and there is more of it than the tidy table suggests, because the whole exercise comes down to two questions. Who actually counts as a peer, and what explains the difference? Who counts as a peer comes first, because everything else is computed from the peer set. The table below is a practice set of five, with the subject company at the bottom, and one of the five has a problem that the note explains.
Practice peer set: EV/EBITDA
| Company | EV/EBITDA |
|---|---|
| Peer A | 8.0x |
| Peer B | 10.0x |
| Peer C | 12.0x |
| Peer D | 14.0x |
| Peer E | 30.0x |
| Subject company | 10.0x |
Take a look at Peer E before moving on. A buyout rumor was recently announced there, which means that its multiple includes a takeover premium rather than a verdict on the underlying business.
The Comps tab summarizes a peer set with one number, and which number it picks matters more than it looks. There are two candidates, the mean and the median, and Peer E is exactly the kind of company that tells them apart. Let's compute both.
Worked example: Worked example: median, mean, and the outlier
Let's take the five peers above, one of which has been distorted by the rumor, and watch what each kind of average does with them.
- The mean (8 + 10 + 12 + 14 + 30) / 5 14.8x. One rumor-inflated peer dragged the "average" above four of the five companies in it.
- The median Sort: 8, 10, 12, 14, 30. Take the middle value. 12.0x. The median ignores Peer E entirely, which is why the Comps tab's highlighted row is a median, not a mean.
- Place the subject Subject at 10.0x versus the 12.0x median: (10 − 12) / 12 A 16.7% discount to peers. That is a fact. "Therefore it is cheap" is a hypothesis, and it has two competing explanations.
- The two explanations Either the market is mispricing the subject (your opportunity), or the subject deserves its discount (slower growth, worse margins, more debt, weaker moat). The rest of the Research tabs exist to break this tie, Competitive Position for the moat, Earnings for quality, Capital for discipline. A difference in multiples is where the question starts.
The widget below lets you drag Peer E's multiple up and down and watch what happens to each average. The mean follows it wherever it goes, and the median does not move until Peer E crosses one of its neighbors.
A median is also the tool for turning a peer set into a price. Multiply the peer median multiple by the subject's own figure, and you get the price the subject would trade at if the market valued it exactly like its peers. That number is called an implied value, and the check below runs one.
Practice
Implied-value exercise: the peer median P/E is 18.0x and your subject earns $3.00 of EPS. What share price does peer-parity imply?
Solution. 18 × 3.00 = $54.00. If the stock is trading at $45, then peer-parity implies 20% upside. Before writing that number down anywhere, take a moment to notice the condition it rests on. The upside is only real if the subject deserves the median multiple, and nothing in the multiplication above tells us whether it does.
That condition is the step students most often skip. A discount to peers is only a bargain if the company belongs with those peers, and the question below is the standard case of a company that does not.
Check yourself
A stock trades at 8x EV/EBITDA against a 12x peer median. Its revenue is shrinking 5% a year while every peer grows 10%. The discount most likely means:
- A bargain: 33% cheaper than peers. Be careful here. A discount to peers only means something if the company actually resembles those peers, and a business that is shrinking while every peer grows does not resemble them in the way that matters most. In other words, the difference in growth calls the whole peer set into question before it tells us anything about price.
- Fairly priced or worse: the market is charging less for a shrinking business. (correct) Right. A multiple embeds the market's expectations about growth, which means that a business losing revenue every year SHOULD trade below businesses that are growing. The trade only starts to work if you have evidence that the shrinkage is ending, and notice that such evidence is a thesis about the business rather than about the multiple.
- A data error: multiples cannot diverge that far within a sector. Multiples diverge this far within a sector all the time, and figuring out why the market prices one company so differently from another is a large part of an analyst's job.
That question was really a question about the peer set, and the peer set is the one input on the Comps tab that belongs to us rather than to the data. When we load a ticker, the tab starts from a default list built from the company's industry, so an automaker is compared with other automakers and a chip designer with other chip companies. Only when Sifter has no list for the industry does it fall back to a list for the whole sector, and the fallback is a good deal rougher, because a sector is much broader than an industry (the consumer cyclical sector, for example, puts a car company in the same group as a home-improvement retailer and a fast-food chain, and nobody would argue that those three businesses should trade at the same multiple).
Either way, the default is only where the tab starts. Each chip across the top of the card can be removed, the Add peer button puts in any ticker we think belongs, and Reset to default brings back the original list if our edits get out of hand. This means that the median at the bottom of the table depends on our choices as much as on the data, and a committee is entitled to ask why each peer is in the set (and why some obvious candidate is not). A good answer points to something the companies actually share, such as the customers they sell to, the way they make money, their size or how fast they are growing, rather than the fact that a data vendor filed them under the same label. If you catch yourself adding a peer because it makes the subject look cheaper, take that as a sign to stop and rebuild the set from the beginning.
The Competitive Position tab helps with this judgment, because it shows the company's revenue by segment for each of the last few fiscal years, both by product line and by region, as the company reports it in its filings, along with each segment's growth in the latest year. Imagine a company that the data files under hardware, but whose segment table shows $700M of its $1,000M in revenue coming from subscription software that grew 25% last year, while the hardware segment shrank 5%. A peer set made entirely of hardware makers will make that company look expensive on almost every multiple, and we would be right to ask whether software companies belong in the set instead (or at least alongside the hardware makers).
Every multiple in this chapter so far has been a positive number, and that is not an accident of the examples. Imagine a company worth $400M on the market that lost $50M last year. Divide one by the other and the P/E comes out at 400 / −50 = −8x, which looks like the cheapest stock in any table you could build. Now suppose the business improves and the loss shrinks to $4M. The P/E becomes 400 / −4 = −100x, so the multiple fell a long way while the company got better, and if the company had instead earned a $4M profit, the P/E would be +100x. In other words, once the number underneath is negative, the multiple stops behaving like a price at all, because a smaller loss gives a more negative multiple and the size of the number no longer tells us whether the stock is cheap or expensive.
Analysts call a multiple like this not meaningful (NM), and the Comps tab follows the convention. A multiple at or below zero still shows its number, followed by a small NM tag (hover the tag and the page states the rule), but the tab leaves it out of the peer medians, the cell colors, the chart and the verdict. The same treatment applies to EV/EBITDA when EBITDA is negative. The check below shows what goes wrong in a median if we forget to do this.
Practice
A practice peer set has P/E multiples of 15x, 20x, −8x, 25x and 30x, where the −8x belongs to a peer that lost money last year. What peer median P/E does the Comps tab show?
Solution. Leaving out the −8x leaves 15, 20, 25 and 30, and with four values the median is the average of the middle two, (20 + 25) / 2 = 22.5x. If we had left the money-losing peer in, the sorted list would be −8, 15, 20, 25, 30 and the median would be 20x, which means that a subject trading at 21x would look like it sits above its peers when it actually trades below them. The loss tells us nothing about what the market pays for a dollar of earnings, so the tab does not let it move the median.
The harder case is when the money-losing company is the one we are researching. A young company with negative earnings and negative EBITDA, which analysts expect to lose money again next year, has no usable P/E, forward P/E or EV/EBITDA, and that leaves only two of the five multiples the verdict looks at. When fewer than three usable multiples remain, the tab does not try to call the stock cheap or expensive. The verdict box says Limited comparison instead, lists which multiples are not meaningful, and points us to price-to-sales and EV-to-revenue, compared with peers at a similar stage.
Revenue is the natural place to fall back to, because it is positive for almost any company that sells something, which means that a revenue multiple still compares prices before the profits have arrived. Having said that, a revenue multiple makes a strong assumption, since it treats a dollar of sales at a company losing money the same as a dollar of sales at a company keeping twenty cents of it as profit. For that reason the choice of peers matters even more here. Comparing a money-losing software company on EV/revenue with mature, profitable peers will make it look expensive almost every time, and the more useful comparison is with companies that are growing at a similar rate and are a similar distance from profit.
Check yourself
The company you are researching lost money last year, its EBITDA is negative, and analysts expect another loss next year. The Comps verdict says Limited comparison. What is the most sensible next step?
- Treat it as cheap, since its P/E of −12x is the lowest in the table. A negative P/E is not a low price. It means there are no earnings to price, and as we saw above, a company whose loss is shrinking gets a MORE negative P/E, so the number points the wrong way as the business improves.
- Compare it on price-to-sales and EV-to-revenue, with peers growing at a similar rate and a similar distance from profit. (correct) Right. Revenue multiples still work when profits are negative, and choosing peers at a similar stage keeps the comparison from charging a young company for not yet earning what a mature one earns. Remember that a revenue multiple treats every dollar of sales as equal, so the margin the company is heading toward is still part of the case you have to make.
- Remove peers until three multiples become usable again. The multiples that are not meaningful belong to the subject, not to the peers, so no change to the peer set can bring them back. Removing peers would only move the medians, and moving the medians to get a verdict is the kind of peer selection a committee should push back on.
Companies listed abroad raise a practical problem of their own, and it shows up most clearly in the forward P/E.
Comps has a sibling on the Research rail that uses the same peer set to answer a different question, about price paths rather than multiples.
The lab audits the median on a real peer set, and its last step asks for the sentence most students would rather not write.
Lab: CSV lab: audit the median
- Open Research, load a holding, and go to the Comps tab. From there, adjust the peer set until you believe it (remove the obvious non-comps with their chips, use Add peer for any company that belongs, and write down one reason for each peer you keep).
- Download the tab's Verify CSV.
- In a spreadsheet, compute MEDIAN() over the EV/EBITDA column for the peers only, leaving out the subject and any value at or below zero, and confirm that it matches the file's Median row (the same figure as the table's Peer Median row).
- Compute your subject's premium or discount to that median, and then write the one-sentence version of BOTH explanations (mispriced versus deserved). If you cannot bring yourself to write the "deserved" sentence, you have not looked hard enough yet.
The Analyst's Handbook is Sifter's textbook for student investors, written by Matt Lang and Bree Lang. Sifter is free for students. This chapter as markdown.