Chapter 20: The screener and macro context
Filters as inequalities, and reading the yield curve before you buy.
By Matt Lang and Bree Lang · About the authors
Where this is on Sifter: Research · Screener + Macro
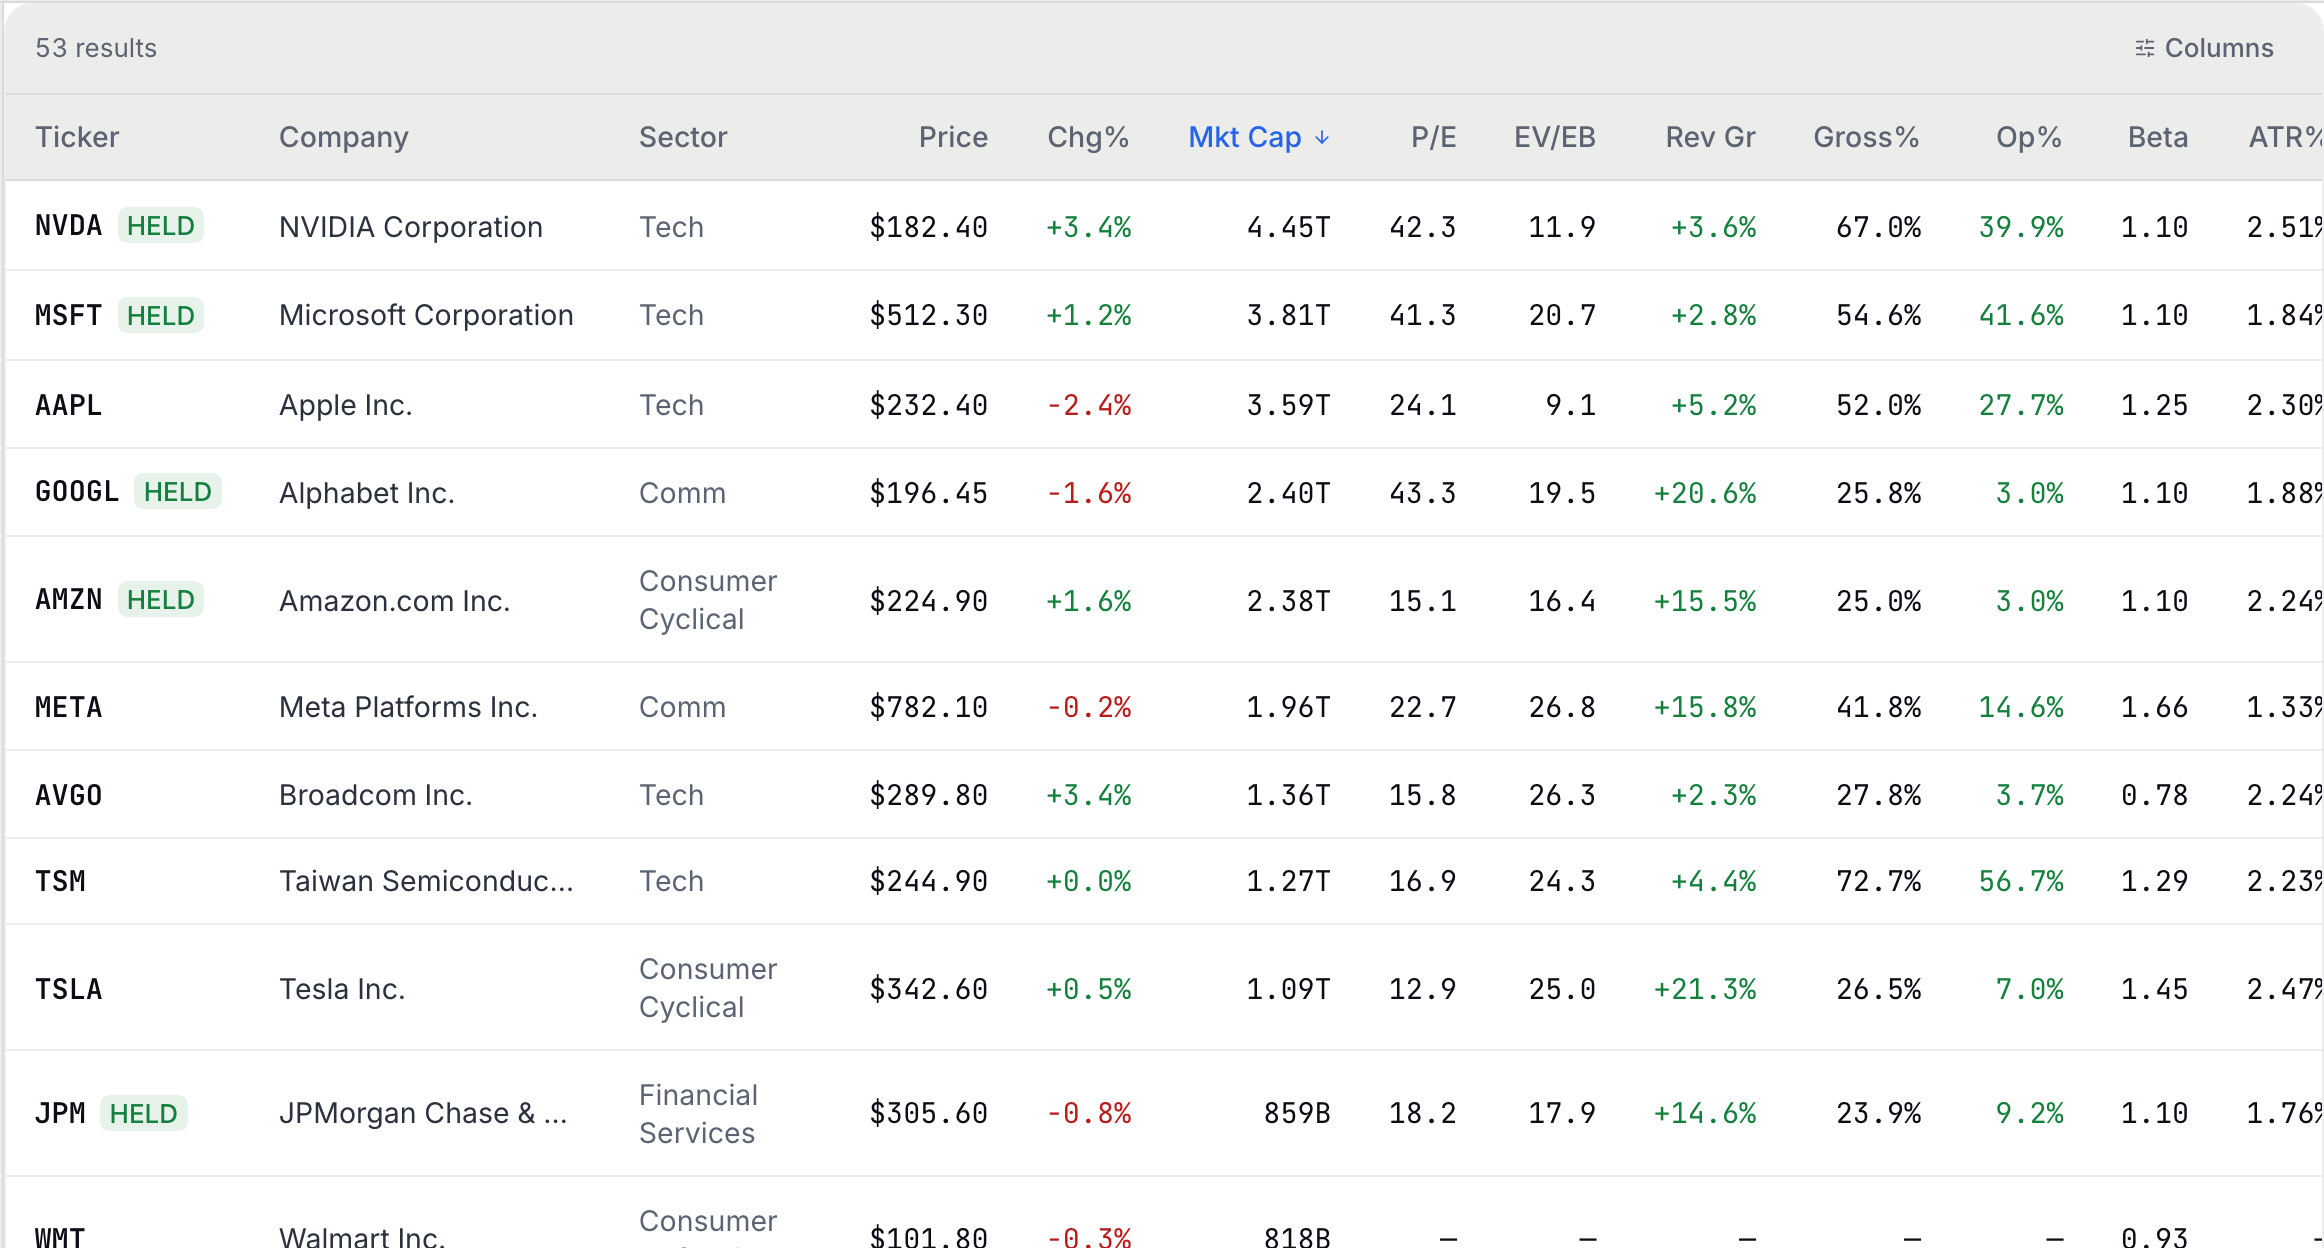
Imagine that you sit down at the Research surface with no ticker in mind, hoping to find your next idea rather than to study one you already have. The Screener is the prospecting end of Research, and it is built for exactly this situation. It is a large table of metrics (the Chapter 15 statistics, computed for hundreds of companies at once) with a row of filters along the top, and every one of those filters is an inequality with a fixed threshold picked from a menu. Ask for operating margin "Over 20%" and the Screener keeps the rows where margin > 0.20 and discards the rest; the menus cover sector, market cap, P/E, EV/EBITDA, revenue growth, gross and operating margin, beta and relative volume, and a row of presets (High Growth, Deep Value, Quality, Mega Cap, Low Volatility) that simply fill several menus at once. Stack several filters and you are intersecting sets, keeping only the companies that pass every test at once. This means that a screen is a database query, and there is no magic hiding anywhere in it. The figure below is the results table on the demo, one row per company that passed, with the filter menus just above it out of frame.
So if a screen is just a query, where does the skill come in? The skill is in the design. A screen with eight severe filters returns three companies that you already own, and a screen with one loose filter returns four hundred companies that you know nothing about, and neither list gets your research anywhere. The useful screens live in between, because a good screen encodes a thesis. Suppose the idea you want to explore is "Quality compounders at a sane price". Written in the Screener's menus, that idea might come out as gross margin over 50%, operating margin over 20%, revenue growth over 10%, and P/E under 30. In other words, the filters and the thesis are the same statement written in two different languages, and if you cannot translate your idea into a short list of inequalities, the idea is probably not specific enough to screen for yet.
Before you run off and build one, though, there is a blind spot that every screen inherits from the table it searches, and the question below walks you straight into it. Give it a try before reading on.
Check yourself
Imagine that you screen the S&P 500 for "10 years of uninterrupted dividend growth" and the companies that come back have splendid 10-year returns. Where is the hidden flaw?
- Dividends are irrelevant to total return. Dividends make up a large share of long-run total return, so the flaw is not here.
- Survivorship: you searched TODAY'S index members for a 10-year property only survivors can have. (correct) Right. Take a moment to think about who is missing from today's index. The companies that cut the dividend and cratered fell out of the index along the way, which means that they also fell out of your screen, and the splendid returns belong only to the survivors. If you had run this screen ten years ago, you could not have gotten these results. Any screen that conditions on a long history inherits this bias, so treat the backtested glow with suspicion.
- Ten years is too short a window for dividends. The length of the window is a choice rather than a bias, and the real trouble is who is left standing to be screened at all.
Every screen you build runs in front of a backdrop, and the Macro tab shows that backdrop. Think of it as the weather report for the whole market. The tab shows index levels, the dollar, gold, oil, the VIX and an economic calendar (everything short of the barometric pressure), and at the center of it all is the Treasury yield curve. The name sounds more technical than the thing itself, because the yield curve is simply the interest rate that the United States is charged at every borrowing horizon, from one month out to thirty years.
In ordinary times, the long rates are above the short ones, which should feel natural, since lending money for thirty years ought to pay better than lending it for two. Every so often, though, the short rates climb above the long ones, and when that happens the curve is inverted. Take a moment to think about what an inverted curve is telling us. The bond market is betting that rates will soon be cut, and rates, historically, get cut because something somewhere has broken.
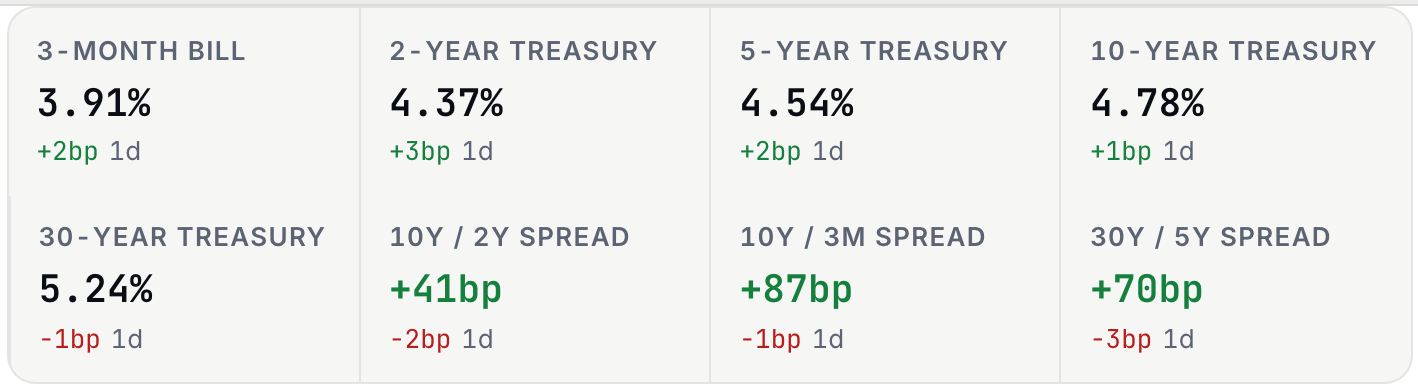
The single most-watched summary of the curve is the 2s10s spread, which you get by taking the 10-year yield and subtracting the 2-year yield. You may be thinking, "that is one subtraction, and a subtraction seems like a thin basis for a forecast", and the skepticism is healthy, but this particular subtraction has a remarkable record, and the record is earned rather than folklore. When the slope of the yield curve was tested against the other financial variables commonly used, at horizons beyond a quarter the slope was the single best predictor of American recessions, and it usually did better alone than in combination.1 The figure below is the Macro tab's rates card on the sample book, with five Treasury maturities from the 3-month bill out to the 30-year bond and the three spread tiles next to them, the 10Y / 2Y among them.
Spend a minute with the widget below and get comfortable with what normal and inverted look like. Its one slider moves the curve through a business cycle, and the 2-year, the 10-year and the 2s10s spread update as you go, so you can watch the spread change sign at the moment the curve inverts.
The check below asks for the spread from two yields, and the sign matters as much as the size.
Practice
The 2-year Treasury yields 4.80% and the 10-year yields 4.30%. Compute the 2s10s spread in percentage points (sign matters), and know what the sign means.
Solution. 4.30 − 4.80 = −0.50pp. Take a moment to interpret the sign before moving on. A negative spread means the short end is paying more than the long end, which means the curve is inverted. The Macro tab's rates card shows this spread directly as a tile, printed in basis points (so −50 bp here) with the day's change next to it. Remember that an inversion is a market forecast of cuts rather than a countdown timer, and inversions have led recessions by anywhere from months to two years.
Rates do not stay on the Macro tab. They reach every valuation in Chapter 16 through the discount rate, and the box below says how.
Back to the Screener for one more design lesson, because the most common failed screen is not a data problem, and the fix for it is not more filters.
Check yourself
Imagine that you set the Screener to Mega Cap AND revenue growth over 30% AND P/E under 10, and the screen returns almost nothing. What went wrong, structurally?
- The screener data is incomplete for large caps. Coverage is actually at its best for large caps, so the emptiness comes from the logic rather than from the data.
- A giant company growing 30% a year does not trade at ten times earnings: the filters fight each other. (correct) Right. Each filter is perfectly reasonable on its own, but their intersection is nearly empty, because the third condition selects a different corporate personality than the first two. The market pays up for fast growth, so the sort of company that clears a 30% growth bar is almost never the sort that sells for ten times earnings, and asking for both at once leaves almost nobody. When this happens, good screen design loosens the least-essential constraint first.
- AND logic is wrong; screens should use OR. Switching to OR would return a meaningless union. The real fix is to rethink which conditions express the thesis rather than to swap the operator.
The lab closes the loop between the two surfaces, a screen with a thesis behind it and a rate regime to read it against.
Lab: CSV lab: verify two rows
- Open Research › Screener and build a 2-3 filter screen that encodes a one-sentence thesis (write the sentence first).
- Export the results with the download button above the results table.
- Pick two companies from the results, open each on the Research Overview tab, and verify the screener's gross and operating margins against the Overview tiles; both read the same annual income statement, so they should agree to the rounding. Compare the P/E too: both surfaces now price it at today's market cap over the last fiscal year's earnings, so they should agree to within the day's move.
- On the Macro tab, read the "10Y / 2Y Spread" tile on the rates card, and add one line to your thesis sentence about whether the current rate regime helps or hurts this screen's kind of company.
Sources
- Estrella, A., and Mishkin, F. S. (1998). Predicting U.S. recessions: Financial variables as leading indicators. Review of Economics and Statistics, 80(1), 45-61 https://direct.mit.edu/rest/article/80/1/45/57058/Predicting-U-S-Recessions-Financial-Variables-as
The Analyst's Handbook is Sifter's textbook for student investors, written by Matt Lang and Bree Lang. Sifter is free for students. This chapter as markdown.