Chapter 14: The optimizer
What mean-variance optimization finds in your data, and what it trades away.
By Matt Lang and Bree Lang · About the authors
Where this is on Sifter: Portfolio · Simulate · Optimize
Everything in Unit II described the book you already have, and Chapter 9 ended by naming the bet inside it. So what would the book look like if the weights were chosen by the math instead? The Optimize tab in Simulate turns the machinery around and searches for exactly that, solving a mean-variance problem (the idea for which Harry Markowitz shared a Nobel Prize)1 over the realized daily returns of your holdings across the backtest window. This means that you have to run a backtest first (Chapter 11) and that every holding needs at least 30 days of history; without those the tab falls back to a rough re-tilt and says so. The inputs are the ones you would expect: each holding's arithmetic average daily return, annualized, and the sample covariance matrix of the daily returns. The search is long-only and fully invested, no position may go above the cap you set (15% by default, and the menu runs from 5% to 20%), and the sector cap and the turnover budget enter as penalties that the solver then tightens until they hold. When it finishes, the tab shows four portfolios side by side: your Current weights, Max Sharpe, Min Variance and Risk Parity. Behind the scenes it also traces a 25-point efficient frontier between the minimum-variance portfolio and the maximum-return one, and Max Sharpe is simply the best point on that grid (or your current book, if it already beats the grid and breaks no constraint). The frontier itself is not drawn on the tab; it is written out in the Verify CSV, one row per point, if you want to plot it. Risk Parity here is the inverse-volatility portfolio, each weight proportional to one over the holding's volatility and then pushed inside the constraints, which is the quick version of the idea rather than the full equal-risk-contribution solve. The check below confirms that the arithmetic behind the tiles is nothing new.
Practice
The optimizer reports its Max Sharpe portfolio at 14.0% expected return and 12.0% volatility, with the risk-free rate at 5.3%. Verify the Sharpe ratio it should be reporting.
Solution. (14.0 − 5.3) / 12.0 = 0.725. Notice that the optimizer has invented no new math here, because it is simply searching through weight-space for the portfolio that maximizes the same ratio we built in Chapter 5.
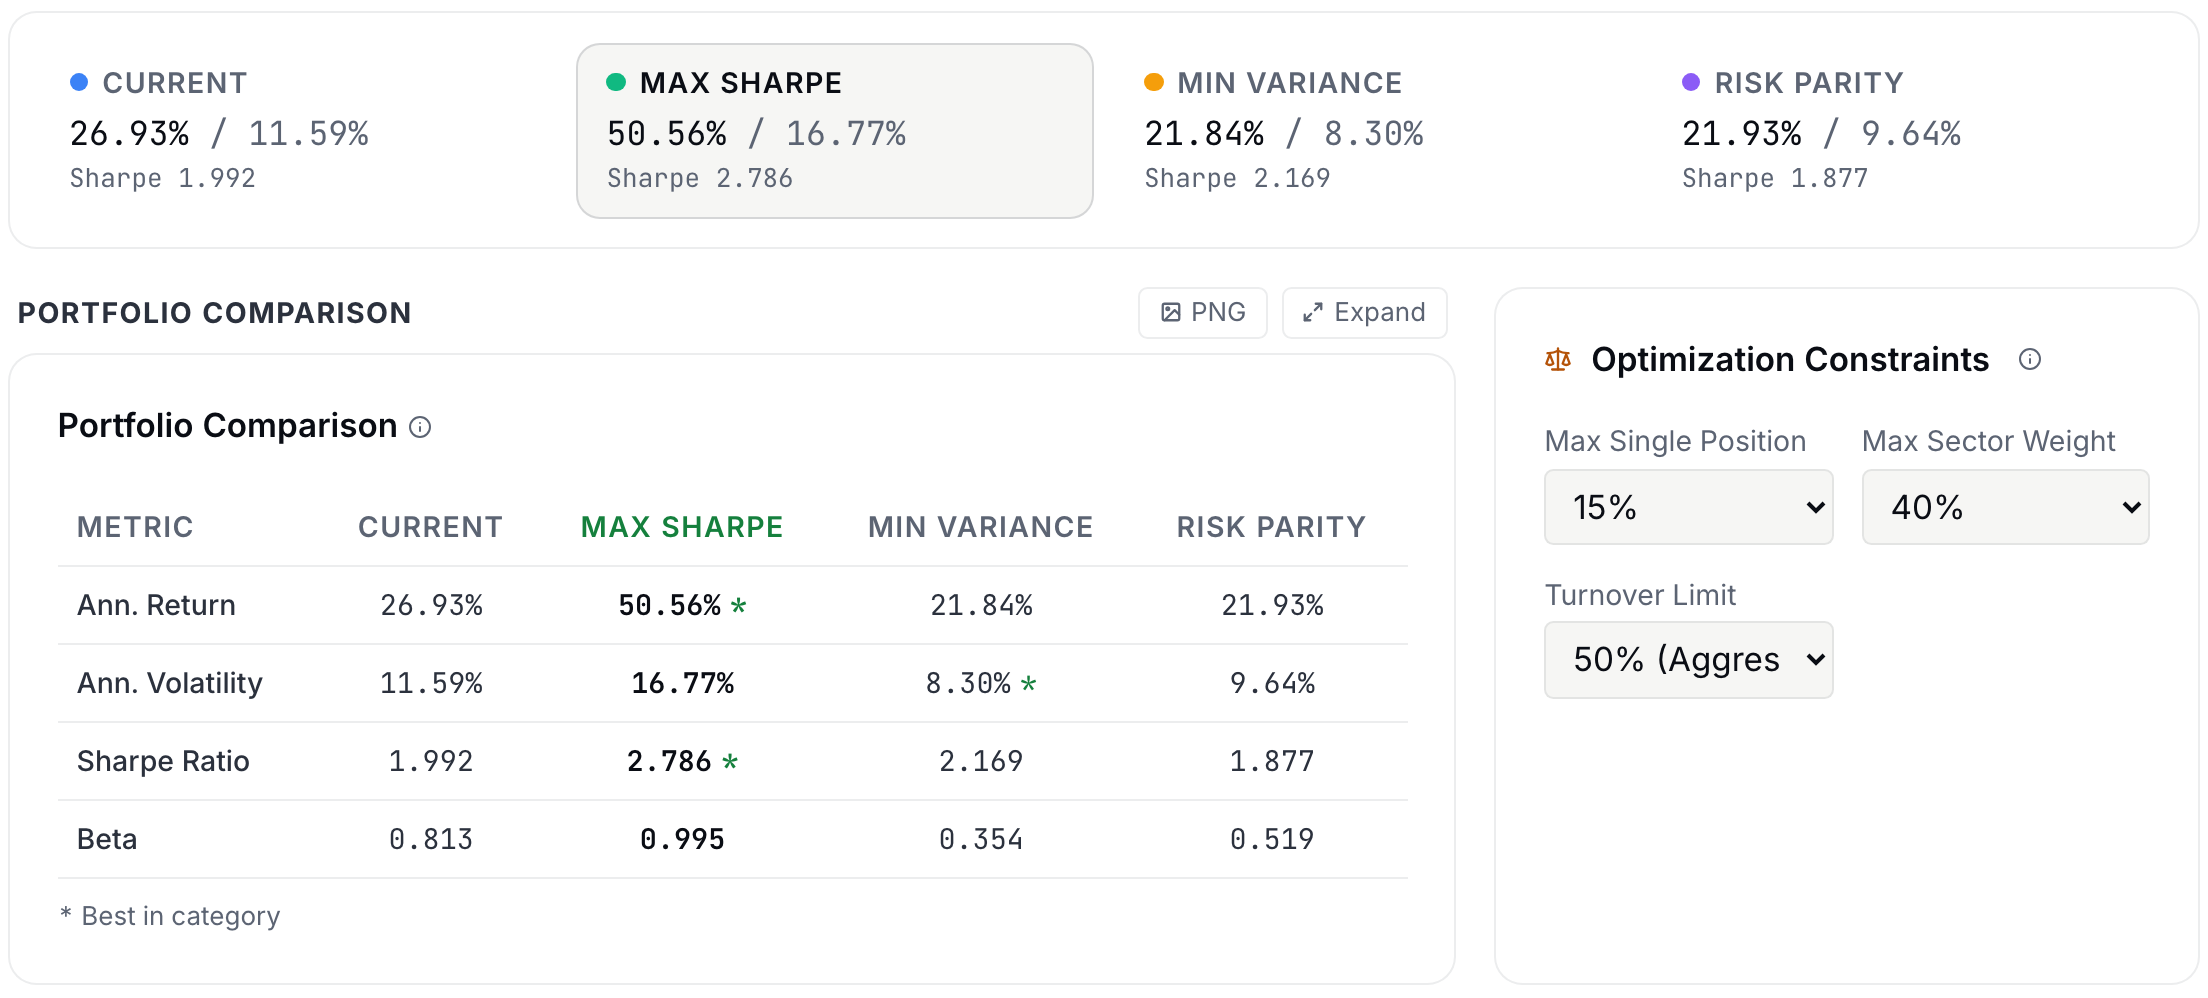
The figure below is the tab on the sample book after a one-year backtest, and it shows what an optimizer does when you let it. The Max Sharpe column claims a 50.6% return at 16.8% volatility, against the book's actual 26.9% at 11.6%, and it gets there by lifting six holdings to 11.8% each and cutting a dozen others to about 1%. Notice that 11.8% is not the 15% position cap. The 50% turnover budget ran out first, which is what the constraints panel on the right is there to tell you. The tab's own note says the rest: these weights would have been optimal over the past window, and they are not a forecast.
Check yourself
The Max Sharpe portfolio puts 15% (the cap) in your three best recent performers and zero in four holdings. The right conclusion is:
- Execute it: the math found the best portfolio. The math did find the best portfolio, but only for the inputs it was handed, and the inputs (estimated returns and covariances) come from a finite, recent sample. Optimizers amplify estimation error, which means that the holdings that looked best in-sample receive the most weight and go on to generate the most regret.
- Treat it as a diagnostic: it shows which bets dominate your data, not orders to fill. (correct) Right. Mean-variance output is highly input-sensitive (the methodology lists this caveat itself), and the 15% cap and the sector penalties exist precisely to blunt that sensitivity. The productive way to use the output is to read it as an answer to the question, "where does my data say risk is being paid?", and then to make the decision the way an analyst would.
- Ignore it: optimization has no place in fundamental investing. This swings too far in the other direction. Min Variance and Risk Parity weights lean on the covariance matrix rather than on the return estimates, which makes them far steadier, and they make useful reference points even for pure stock pickers, while the frontier (in the Verify CSV) shows you the cost of concentration.
Lab: Lab: what the optimizer would change
- Run a backtest in Simulate (Chapter 11), then open Evaluate › Optimize and read the four tiles, Current, Max Sharpe, Min Variance and Risk Parity.
- Select Min Variance and read the rebalance list against your actual weights. The difference on each holding is roughly a measure of "how much of this position is conviction rather than risk-efficiency."
- Download the Verify CSV and plot the 25 frontier rows, volatility across and return up. Your Current book is below or to the right of the curve, and the vertical distance to it is the return the data says your convictions cost over the window.
- Change the position cap in the constraints panel and rerun. If the Max Sharpe weights move a lot, the answer came from the cap and not from the data, and nobody should quote it without saying so.
Sources
- Markowitz, H. (1952). Portfolio selection. Journal of Finance, 7(1), 77-91 https://onlinelibrary.wiley.com/doi/10.1111/j.1540-6261.1952.tb01525.x
The Analyst's Handbook is Sifter's textbook for student investors, written by Matt Lang and Bree Lang. Sifter is free for students. This chapter as markdown.