Chapter 10: Sleeves
Running a fund of sub-funds: drift, contribution, and TE share.
By Matt Lang and Bree Lang · About the authors
Where this is on Sifter: Portfolio · Analyze · Sleeves
Most student funds of any size eventually run into the same organizational problem, which is that one investment committee cannot pay close attention to every holding at once. The usual solution is to split the book into sleeves, sub-portfolios with mandates of their own. Some funds carve the book by style (a growth sleeve and an income sleeve), some carve it by sector, and some hand each analyst team a sleeve to run (an arrangement that doubles as a leaderboard). However the book gets carved, each sleeve ends up with a mandate and a slice of the fund's capital, which means that each sleeve can now be asked the same questions any manager gets asked.
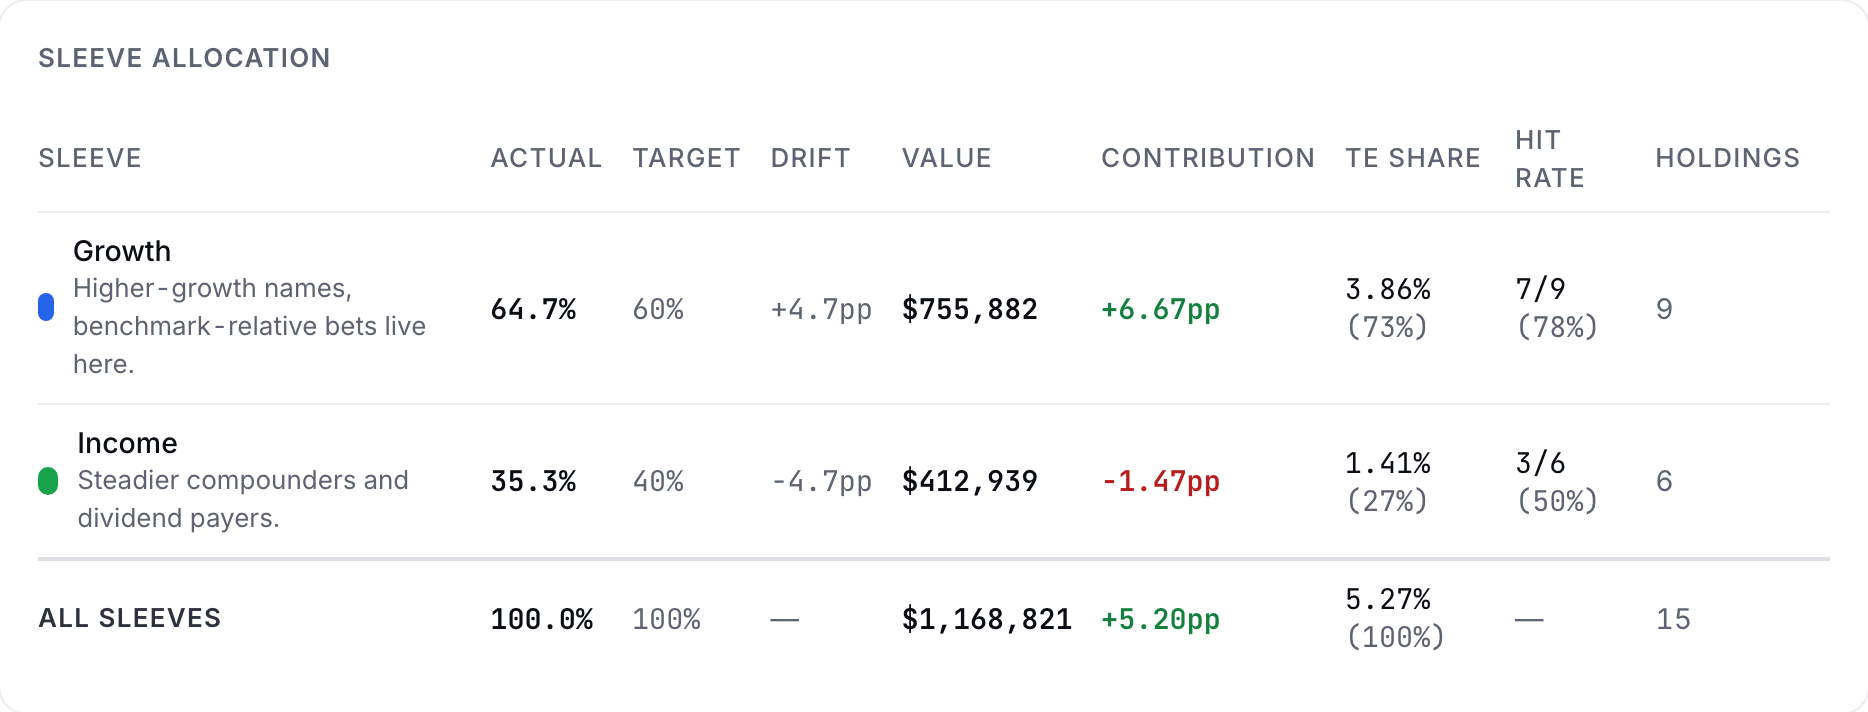
The Sleeves tab puts three of those managerial questions to every sleeve. First, is the sleeve the size it promised to be? The tab measures this as drift, the difference between the sleeve's actual weight and its target. Second, what has the sleeve added to the fund's results? This is its contribution. Lastly, how much of the fund's active risk is the sleeve spending? This is its TE share, and because it is the least familiar of the three, we will take it slowly when we get there.
If your book has no sleeves defined, the Sleeves tab will be empty, and there is nothing wrong with that. Read this chapter as reference material for the day your fund decides to organize itself (sleeves are configured in Manage), and work the examples from the Maple Fund table below in the meantime.
Drift
Each sleeve has a target weight set in Manage. Drift is how far reality has wandered from the plan, in percentage points. Markets move your weights every day even when you trade nothing: winners grow their own allocation.
Maple Fund sleeves (within the active book)
| Sleeve | Holdings | Target | Actual |
|---|---|---|---|
| Growth | MPL | 55% | 60% |
| Income | BRC, CDR | 45% | 40% |
Weights are measured within the active sleeve of the book, and the index ETF is outside the sleeve structure. Before doing any arithmetic, take a second and compare the Target and Actual columns, because you can already see which sleeve has grown past its mandate and which has slipped below it.
Practice
Compute the Growth sleeve's drift, in percentage points (sign matters).
Solution. 60% − 55% = +5pp. This means that the Growth sleeve is running 5 points heavier than its mandate, almost certainly because MPL rallied. The fund now has a real decision on its hands, because it can trim the sleeve back to target or it can let the winner run and accept the drift.
Sleeve tracking error share
Each holding's MCTE (Chapter 8) is its share of the fund's tracking error. Summing MCTEs within a sleeve and scaling gives the sleeve's slice of the fund's active risk, built so the sleeves sum exactly to the fund TE. A sleeve with 20% of the capital can easily hold 50% of the risk.
Check yourself
The Income sleeve holds 40% of the book but only 15% of the fund's tracking error. The Growth sleeve holds 60% of the book and 85% of the TE. Which conclusion is right?
- Something is broken: risk shares should match capital shares. In practice the two shares almost never match, and the mismatch is the very thing the table is trying to show you. Capital and active risk are two different budgets, and a sleeve is free to draw heavily on one while barely touching the other.
- The fund's benchmark-relative bets live almost entirely in the Growth sleeve. (correct) Right. Income's holdings move very much like the benchmark, which means the sleeve has very little active risk per dollar. Growth is where the fund actually deviates, so if the fund underperforms, the explanation will be found in Growth.
- The Income sleeve is underperforming. Not quite, because TE share says nothing about returns. It measures how far a sleeve deviates from the benchmark rather than which direction the deviation went, and a sleeve carrying nearly all of the fund's risk can turn out to be its best performer or its worst.
Two more columns round out the table. A sleeve's contribution is its holdings' CTEs summed together, which tells you how many points of active return the sleeve actually delivered, and its hit rate is the share of its holdings beating the benchmark. Take a moment to notice how much a single row now covers. A fund president who wants to know whether a sleeve is on-mandate checks the drift, a president who wants to know whether the sleeve is pulling its weight checks the contribution and the hit rate, and a president who wants to know whether the sleeve is worth the risk it spends checks the TE share. That is a lot of oversight for one row of a table. The Sleeve Allocation table below, captured from the sample book, is that row on a real book.
Lab: CSV lab: audit one sleeve row
- On Portfolio › Analyze › Sleeves, download the Verify CSV (the sleeve-allocation file). (No sleeves on your book? Define two in Manage › Sleeves & Sectors first, or work this lab with the Maple table above.)
- Pick one sleeve. Verify Drift = Actual% − Target% by hand.
- Verify the TE Share column sums to 100% across sleeves (plus any unassigned line).
- Cross-check contribution: the sleeve's Contribution (pp) should equal the sum of its holdings' CTEs in the HOLDINGS ATTRIBUTION section of Chapter 8's Verify CSV.
The Analyst's Handbook is Sifter's textbook for student investors, written by Matt Lang and Bree Lang. Sifter is free for students. This chapter as markdown.