Chapter 7: Tracking error and information ratio
How far you deviate from the benchmark, and whether the deviation paid.
By Matt Lang and Bree Lang · About the authors
Where this is on Sifter: Portfolio · Analyze · Diagnostics
Imagine that you are handed the records of two funds and asked which one is doing any actual investing. The first fund's returns track the S&P 500 so tightly that you cannot find daylight between them, and the second fund has bet its entire book on three stocks. Hopefully your instinct is that the first fund is not really investing at all and that the second is doing far too much of it, which leaves us with something worth measuring. Where does a fund fall between those two poles? Tracking error answers that question by measuring how differently from the benchmark your portfolio actually behaves, day after day.
The raw material is something we have built once already. Subtract the benchmark's daily return from your own, every day, and the column of differences that piles up is called the active return series. Tracking error is simply the volatility of that series, which means that this chapter is asking you to learn one new idea while reusing machinery you already own.
Tracking error
First subtract the benchmark's return from the portfolio's on every single day, so that you have one active return per day; the standard deviation is taken over THAT series, the daily active returns, and not over the portfolio's own returns. It is the sample standard deviation, annualized with √252. TE = 0 means you ARE the benchmark. Active equity funds conventionally run a few percent to high single digits, with the level set by mandate rather than by nature.
Information ratio
Both annualized, and annualized the way the platform does it for every ratio: the numerator is the mean daily active return times 252, which the Verify CSV prints as Active Return (Ann.), not the period's total active return. The Sharpe ratio's sibling: instead of excess-over-cash per unit of total risk, it is excess-over-benchmark per unit of benchmark-relative risk. It answers: was the straying worth it? The standard reference on active management calls 0.5 good, which is roughly the top quartile of managers, 0.75 very good and 1.0 exceptional.1
Before we work through the hand-calculation, let's give our recurring cast a third act, and this time a new arrival joins them. Recall that Granite and Bottle Rocket both finished +2.0 points ahead of the market last chapter. Run the tracking error under each fund and the tie breaks again. Granite's gentle 0.6-beta glide deviates from the benchmark by roughly 6% a year, which puts its information ratio near 0.33. Bottle Rocket carried the same +2.0 points home through roughly 9% of tracking error, so its information ratio lands around 0.22. Take a moment to think about what those two numbers are telling us. The funds won the same prize, but Bottle Rocket wandered much farther off the course to collect it.
And then there is the newcomer, a polished outfit we will call Veneer Capital, whose returns hug the index so closely that its tracking error is 0.5%. Veneer has never had a bad quarter relative to the benchmark, but that is only because it never actually leaves the benchmark (a student who copies the answer key does not get many questions wrong either). A fund like Veneer is called a closet indexer, because it charges active fees for what amounts to passive behavior, and tracking error is the instrument that catches it in the act. This means that the metric matters to people who allocate money to funds at least as much as it matters to the funds themselves.
Maple Fund: building the active return series
| Day | Portfolio return | Benchmark return | Active return |
|---|---|---|---|
| 1 | 1.00% | 0.80% | 0.20% |
| 2 | -0.50% | -0.20% | -0.30% |
| 3 | 0.20% | 0.30% | -0.10% |
| 4 | 0.00% | -0.10% | 0.10% |
| 5 | 0.75% | 0.50% | 0.25% |
| 6 | 1.00% | 0.70% | 0.30% |
| 7 | -0.25% | -0.40% | 0.15% |
| 8 | 0.40% | 0.30% | 0.10% |
| 9 | 0.10% | 0.20% | -0.10% |
| 10 | 0.60% | 0.40% | 0.20% |
The Active column is nothing more than row-by-row subtraction, the benchmark's return taken away from the portfolio's. It is also the Active Return column of the Verify CSV's DAILY RETURNS section, so on real data you will never have to build it yourself.
Worked example: Worked example: Maple Fund tracking error
Let's walk the three steps that take us from two return columns down to one risk number.
- Build the active series Day by day, r_p − r_b: 0.20%, -0.30%, -0.10%, 0.10%, 0.25%, 0.30%, 0.15%, 0.10%, -0.10%, 0.20% Ten small differences. Note they are mostly positive: this fund has been beating its benchmark gently, not wildly.
- Standard deviation of the differences STDEV.S over the ten active returns. 0.1889% per day.
- Annualize 0.1889% × √252 = 0.1889% × 15.8745 TE = 3.00% annualized. The Maple Fund deviates from its benchmark by about 3% a year of independent movement: a real active fund, not a closet indexer.
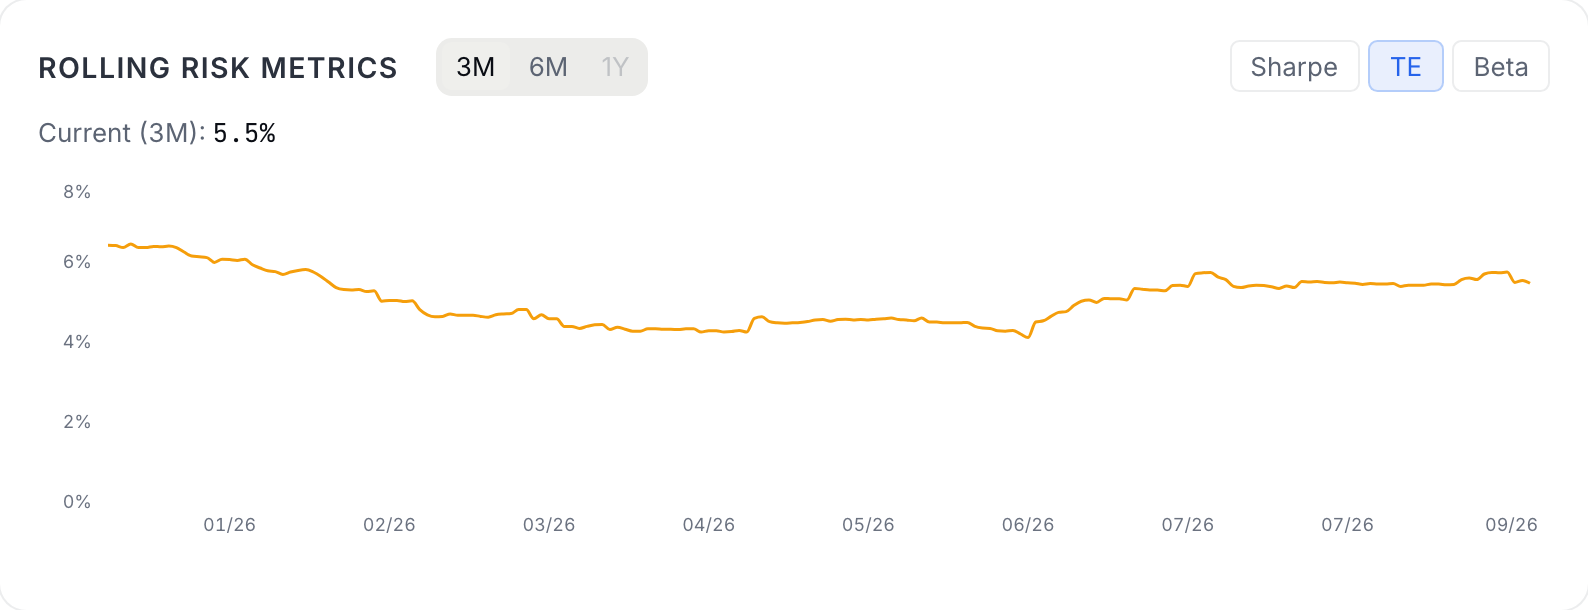
Tracking error is not a fixed property of a fund, because it is measured over a window and the window keeps moving, so a book that added a concentrated position in March will show it climbing through the spring. The Performance tab keeps a Rolling Risk Metrics card for exactly this, inside the collapsed Rolling risk metrics section near the foot of the tab (open it with a click, or lock it open), with a TE button that draws the trailing three-month tracking error day by day, and the figure below shows it on the sample book.
Check yourself
Fund X has active return +1.0pp with TE 0.8%. Fund Y has active return +3.0pp with TE 9%. Which fund showed more skill per unit of active risk?
- Fund Y: it beat the benchmark by three times as much. Be careful, because raw active return says nothing about how much active risk was spent earning it. Work out both information ratios first, and then compare.
- Fund X: its information ratio is much higher. (correct) Right. IR_X = 1.0/0.8 = 1.25, while IR_Y = 3.0/9 = 0.33, so Fund X extracted far more outperformance from every unit of tracking error. Fund Y took big swings and came home with a modest payoff.
- They are equivalent: IR does not apply here. The information ratio is exactly the tool this comparison calls for, and it settles the matter at 1.25 versus 0.33.
Practice
A fund runs an annualized active return of +2.4pp with a tracking error of 4.0%. What is its information ratio?
Solution. 2.4 / 4.0 = 0.60. Take a moment to see where that lands. The standard reference on active management puts a top-quartile manager at about 0.5, calls 0.75 very good and reserves 1.0 for the exceptional, which means that a 0.60 held over a multi-year window is a real result rather than a rounding artefact.1
Lab: CSV lab: rebuild the tracking error
- On Portfolio › Analyze › Diagnostics, download the Verify CSV. One file is enough, because it has both a RISK METRICS section and a DAILY RETURNS section.
- The DAILY RETURNS section already has an Active Return column (portfolio minus benchmark, day by day), so run STDEV.S over it.
- Multiply by SQRT(252) and compare your number with the Tracking Error row of the RISK METRICS section.
- Then take the Active Return (Ann.) row of the same file (the mean daily active return times 252, which is the numerator the platform uses), divide it by your tracking error, and check the result against the reported Information Ratio. The plain Active Return row is the period total and will not reproduce the ratio unless the window happens to be one year.
Sources
- Grinold, R. C., and Kahn, R. N. (1999). Active Portfolio Management: A Quantitative Approach for Producing Superior Returns and Controlling Risk. McGraw-Hill, 2nd edition https://www.semanticscholar.org/paper/Active-portfolio-management-%3A-a-quantitative-for-Grinold-Kahn/75cced88c1199ba9e8607774b62f2af4c92f0875
The Analyst's Handbook is Sifter's textbook for student investors, written by Matt Lang and Bree Lang. Sifter is free for students. This chapter as markdown.