Chapter 4: Money-weighted return
The return your dollars actually earned, the XIRR search that finds it, and why it disagrees with TWR on purpose.
By Matt Lang and Bree Lang · About the authors
Where this is on Sifter: Portfolio · Analyze · Performance
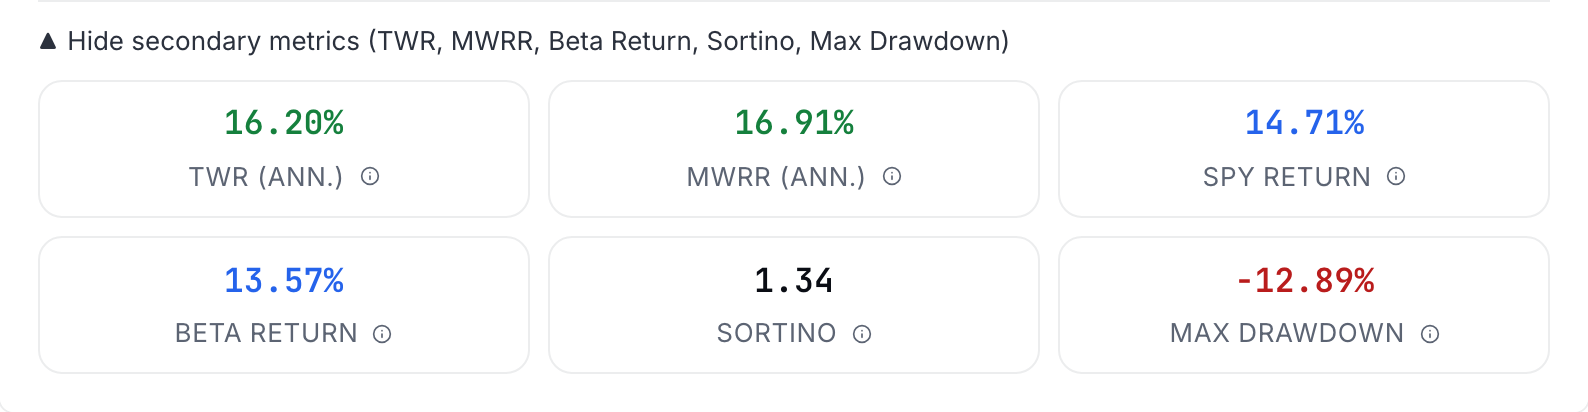
Recall from Chapter 3 that TWR ignores the timing of money on purpose, because its job is to grade the investing rather than the accidents of when the money showed up. That design serves the fund well right up until an alum who wired your fund $50,000 in March calls to ask how the gift is doing. The alum is probably not interested in how the fund performed per dollar per day, and the question on the phone is closer to "how has my $50,000 done since March?", a question TWR cannot answer because the date on the wire is the very piece of information it throws away. The number that can answer is the money-weighted return (MWRR). MWRR weights every dollar by how long that dollar was actually in the book, so the date on the wire starts mattering again. In other words, where TWR strips the flows out of the calculation, MWRR builds the calculation around them. You can see the fund's own figure on the Performance tab by expanding the secondary metrics row beneath the summary and finding the tile marked "MWRR (Ann.)". The figure below shows that row, opened, on the sample book.
So the same portfolio now reports two return figures, and a reasonable first reaction is to ask which of them is correct. The answer is that both are, because they are answers to different questions. TWR grades the investing, and MWRR grades the experience of the dollars that funded it. If a gift happened to arrive the week before a rough stretch, the dollars in that gift will have had a rough first week, but the roughness came from the timing rather than from the stock picking, and it would be unfair to hold the manager responsible for a choice the manager never made. The performance standard draws the same line we are drawing here. GIPS requires time-weighted returns in general, and permits money-weighted returns in the situations where the manager actually controls when the money arrives, on the grounds that nobody should be graded on timing they did not choose.1 Before we can compute anything, though, we need to pin down what MWRR is, and its definition arrives in an unusual shape.
MWRR is defined by a condition, not a formula
Each cash flow is dated: money you put in is negative, money you take out (plus the ending value) is positive, and is that flow's distance from the first one in years (actual/365.25). The that makes the whole sum zero is the MWRR. There is no way to rearrange this and solve for directly, no matter how much algebra you throw at it. The rate has to be found by trial.
So how do we actually find the that makes the sum come out to zero? The only method anyone has ever found is trial. We guess a rate, check the sign of the sum, adjust the guess in whichever direction the sign suggests and repeat until the answer settles down. If that sounds tedious, it is because it is, and the tedium is the reason the search was automated decades ago. Every spreadsheet ships with a function called XIRR that takes a column of cash flows and a column of dates and runs the whole hunt for you. Keep the two terms of this chapter straight and everything that follows will fall into place. MWRR is the return we want, and XIRR is the tool nearly everyone uses to find it. (Sifter runs the same search internally when it fills in the tile.)
Let's make the search concrete with the Maple Fund. Imagine that you are the investor behind it, and that you made exactly three dated flows. You put $10,000.00 in on 2026-01-02, you added another $1,000.00 on 2026-01-12 (the donor's wire, arriving on day 6), and you count the ending value of $11,352.33 on 2026-01-16. Three flows go in and one unknown rate comes out. Before handing the columns to a spreadsheet, we are going to run the search by hand a single time, because watching the guesses close in on the answer is the best way to understand what XIRR is doing for you.
Worked example: Worked example: finding the Maple Fund's MWRR
Guess a rate, compute the net present value (NPV) of the flows at that rate, and let the sign of the result tell you which direction the next guess should move. This is the entire procedure that XIRR automates.
- Set up the condition −10,000 − 1,000/(1+r)^(10/365.25) + 11,352.33/(1+r)^(14/365.25) = 0. Each exponent is calendar days since the first flow divided by 365.25: the wire arrived 10 days in, the ending value is measured 14 days in. Three dated flows, one unknown rate r.
- Guess low: r = 100% annual NPV(100%) = −10,000 − 1,000/(2)^0.0274 + 11,352.33/(2)^0.0383 ≈ −10,000 − 981.20 + 11,054.69 ≈ +73.5 Positive: at 100% the discounted inflows still outweigh the money put in, so the true rate is higher than 100%.
- Guess high: r = 200% annual NPV(200%) = −10,000 − 1,000/(3)^0.0274 + 11,352.33/(3)^0.0383 ≈ −10,000 − 970.37 + 10,884.21 ≈ −86.2 Negative: 200% overshoots. The true rate is now bracketed between the two guesses.
- Close in Halving the bracket repeatedly (Sifter uses a Brent solver, a faster version of the same idea) lands on r ≈ 140.84% annualized. Over the 14 calendar days that is 3.4265%. That figure is the Maple Fund's MWRR. Its TWR over the same days was 3.3373%.
Now let's put the two Maple numbers next to each other, an MWRR of 3.43% against a TWR of 3.34%. (If the bracketing arithmetic above felt heavy, let the solver carry it from here, because the idea we need now is just the comparison.) Take a moment to think about what the difference between those two numbers is telling us. The dollars in the fund did a bit better than the strategy that managed them, and the reason is the timing. The $1,000.00 wire arrived on day 6, just ahead of the fund's best stretch, which means that the new money was present for the good days and missed the earlier losses entirely. Had the donor picked a worse week to be generous, the two numbers would be in the opposite order, and in a real fund they regularly do. This means that the two figures belong side by side on the same report, because each of them is grading something different. TWR grades the manager, and the difference between MWRR and TWR grades the timing of the flows. A fund whose MWRR keeps trailing its TWR is not necessarily picking bad stocks, because the shortfall can come entirely from money arriving at unlucky moments, which is usually nobody's fault.
Check yourself
A student fund posts TWR +8% and MWRR +3% over the same year. The most likely story is:
- The fund made bad stock picks. The stock picks are what TWR measures, and a TWR of +8% says the picks did fine. The difference between the two numbers comes from the timing of the flows rather than from the quality of the picks.
- Large contributions arrived just before a weak stretch. (correct) Right. Money that arrives just before bad weeks earns those bad weeks on a bigger base, so the dollars had a worse experience than the strategy that managed them, and the MWRR lands below the TWR.
- The benchmark outperformed the fund. Neither number involves the benchmark at all. Active return is the measure that would capture that comparison, and the difference between TWR and MWRR comes purely from the timing of the flows.
Practice
Warm-up with one flow: you invest $10,000 and it is worth $10,500 exactly half a year later, with no other flows in between. What is the annualized MWRR, as a percentage?
Solution. (1 + 0.05)^(1/0.5) − 1 = 1.05² − 1 = 10.25%. With one flow in and one value out, there is nothing for the dollar-weighting to do, which means that the MWRR is simply the period return annualized. Give XIRR the same two dated rows and it will return exactly this number.
Lab: CSV lab: find an MWRR with XIRR
- Open the bundled maple_fund_nav.csv below and reduce it to the three dated flows the investor made, which are −10,000 on 2026-01-02 (the starting value going in), −1,000 on 2026-01-12 (the wire, taken from the External Flow column), and +11352.33 on 2026-01-16 (the ending value coming out). Money going in is negative and money coming out is positive.
- Run =XIRR(values, dates) on those two columns, and it should land near the worked example's 140.84%. Spreadsheets count 365 days to a year where Sifter counts 365.25, so do not be alarmed when the last digits differ.
- De-annualize over the window: (1 + XIRR)^(14/365.25) − 1. The result is the period MWRR, the figure this chapter has been holding up against TWR.
- Then repeat the exercise on your real book, using the same three columns over a window of a year or more. The flows are the deposit and withdrawal rows of the Manage › Activity export, the starting value is the book's value on the window's first day (found with the Holdings as-of picker from Chapter 2), and the ending value is today's. Your XIRR should land within a few hundredths of the "MWRR (Ann.)" tile.
Sources
- CFA Institute (2019). Global Investment Performance Standards (GIPS) for Firms, 2020 edition. Effective 1 January 2020 https://www.gipsstandards.org/wp-content/uploads/2021/03/2020_gips_standards_firms.pdf
The Analyst's Handbook is Sifter's textbook for student investors, written by Matt Lang and Bree Lang. Sifter is free for students. This chapter as markdown.