Chapter 1: How Sifter sees your money
A guided tour of the Portfolio Overview: where every headline number is.
By Matt Lang and Bree Lang · About the authors
Where this is on Sifter: Portfolio · Overview
Welcome! Over the course of this book, we are going to take apart nearly every number Sifter puts in front of you and rebuild it from raw data, but nobody should have to do that on day one. Today we are simply going to walk through the front door. When you open Sifter, the first page that loads is the Overview, and it is the one screen that shows the whole financial life of your fund at once. There is nothing to configure and nowhere to get lost, because the page is built so that a brand-new reader can tell, at a glance, whether anything needs attention. Our only job in this chapter is to learn where each number on this page is, so that when you eventually catch yourself asking, "wait, where does this number actually come from?", you will know exactly which chapter to bring the question to. (There is also no math in this chapter at all, which is not something you will hear us say again.)
The big block at the top of the page shows the portfolio value, along with a one-sentence story of how the year has gone so far. Next to it are four smaller figures. vs SPY is the active return, which measures how far ahead of or behind the benchmark you are running. Beta describes how hard your portfolio swings when the market swings, Sharpe tells you how much return you earned per unit of bumpiness, and Positions is a simple count of how many holdings you have. If those one-line descriptions feel a little thin, it is because they are. Three of the four get entire chapters later in this book, so for now, knowing their names and their spot on the page is plenty. The figure below shows the top of the page on the sample book, with the performance chart that the next section walks through underneath it.
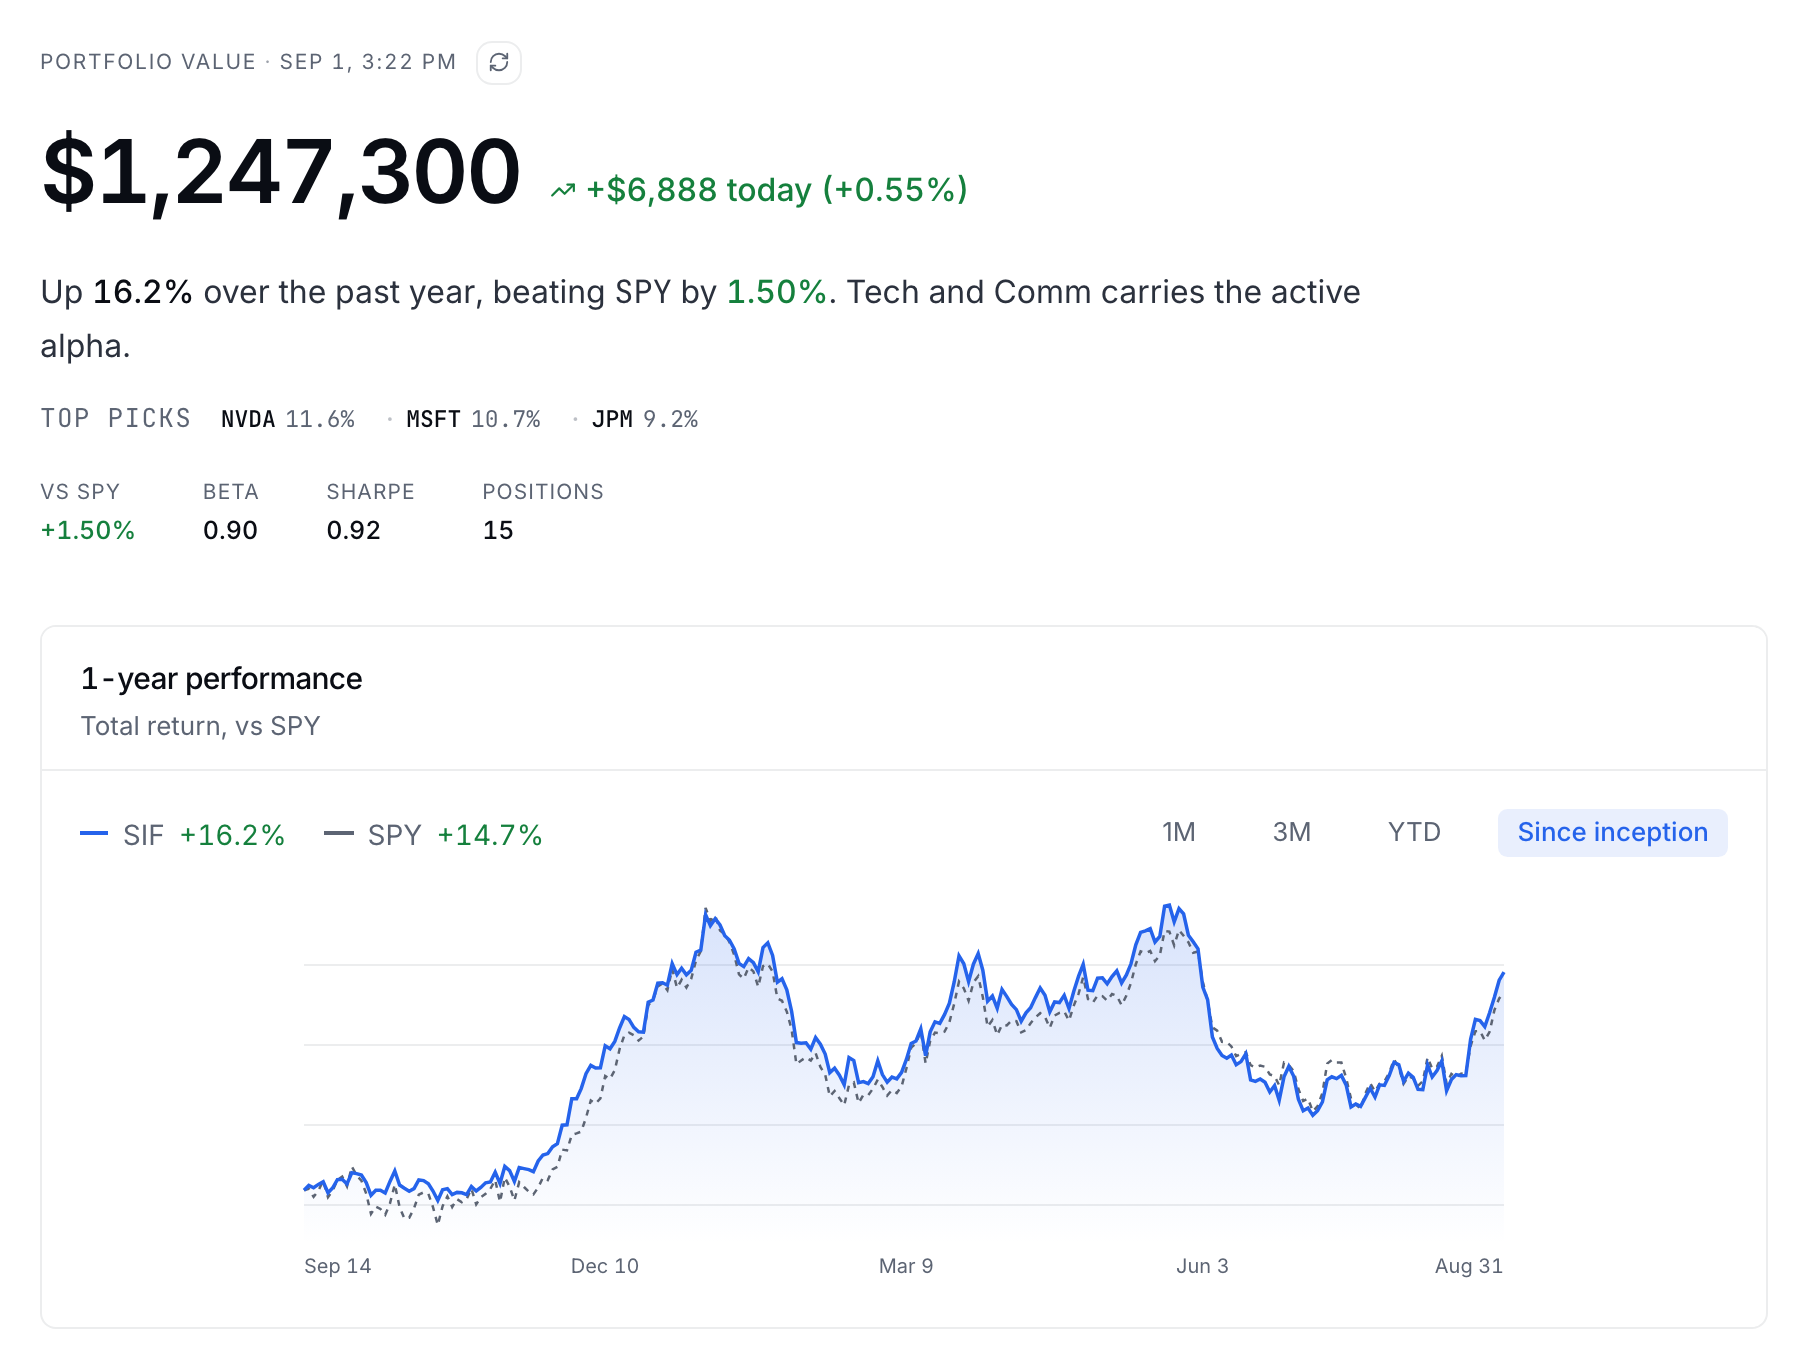
Below the headline block is the performance chart, which draws your portfolio and its benchmark from the same starting line so that the comparison between them is fair from the very first day. The period buttons (1M, 3M, YTD and 1Y) change the window of time you are looking at, and a young book shows Since inception in place of any window longer than its own history. There are two things to know about this chart right away. First, the line is drawn from the daily time-weighted return series, a phrase that Chapter 3 unpacks in full. For now, all you need to know is that money arriving in the account does not bend this line, because the line only responds to the investing itself. Second, take a look at the vertical distance between the two lines at the right-hand edge of the chart. That distance is the same active return printed in the block above, which means that the chart and the number are one fact shown in two different ways.
Beneath the chart, the holdings table lists your top positions by weight, along with their moves on the day and their returns over longer stretches. Click on any ticker and a drill-down for that company opens. Click on "Full portfolio" and you arrive at the Holdings lens, which is where Chapter 2 begins.
Check yourself
On the Overview chart, your line ends at +9% and the benchmark line at +6%. Mid-chart, your fund received a large donation. What does the +9% include?
- The donation inflated it: bigger fund, bigger return. The chart is built from daily time-weighted returns, and a time-weighted return neutralizes a flow on the very day it lands (Chapter 3 shows you the machinery). This means that the donation changed the SIZE of the fund without bending this line at all.
- Only investment performance: the donation does not move the line. (correct) Right. The series is a flow-adjusted TWR, which means that the line answers "how good was the investing" and nothing else. The 3-point difference between your line and the benchmark's line is your active return.
- It depends on which period button is selected. The period buttons change the window you are measuring, but they do not change the methodology, and flows are neutralized at every horizon.
Everything we have looked at so far is on the left side of the page, so let's turn to the right-hand side, which holds the context. There you will find news filtered down to the companies you actually own, the week's events (earnings dates, Fed meetings and economic releases), and, if you run the book with teammates, a feed of who touched what. Notice that none of this is computed from your holdings. It is there so that the numbers on the left arrive with their stories attached.
Start one small habit on day one. Find the as-of timestamp, because prices on this page update on a cycle rather than tick by tick, which means that every number you are reading was true at a particular moment rather than at this very second. In other words, each figure on the page comes with a time attached to it, and you should get in the habit of glancing at that time before you quote any number to anyone.
Check yourself
Where does the headline return on the Overview actually come from?
- Ending value divided by starting value. This is the ratio most people reach for first, but it is contaminated by deposits and withdrawals. Chapter 3 shows that on a small fund it can be off by 10 points.
- A chained series of flow-adjusted daily returns. (correct) Right. The platform takes each day's return, neutralizes the external flows, and multiplies the daily results together. Chapter 3 has you compute the number by hand and then reproduce the platform's figure from its own CSV.
- The average of each holding's return. Averaging each holding's return ignores the weights and ignores the flows. The real pipeline goes from transactions to daily values to chained returns.
The Analyst's Handbook is Sifter's textbook for student investors, written by Matt Lang and Bree Lang. Sifter is free for students. This chapter as markdown.